
Sales & CRM


Social Media Analytics Excel - Free Template
Track post metrics, platform totals, content insights, and notes in one Excel workbook for social media reporting.
2026-07-22
273 downloads
4.8/5
Download template
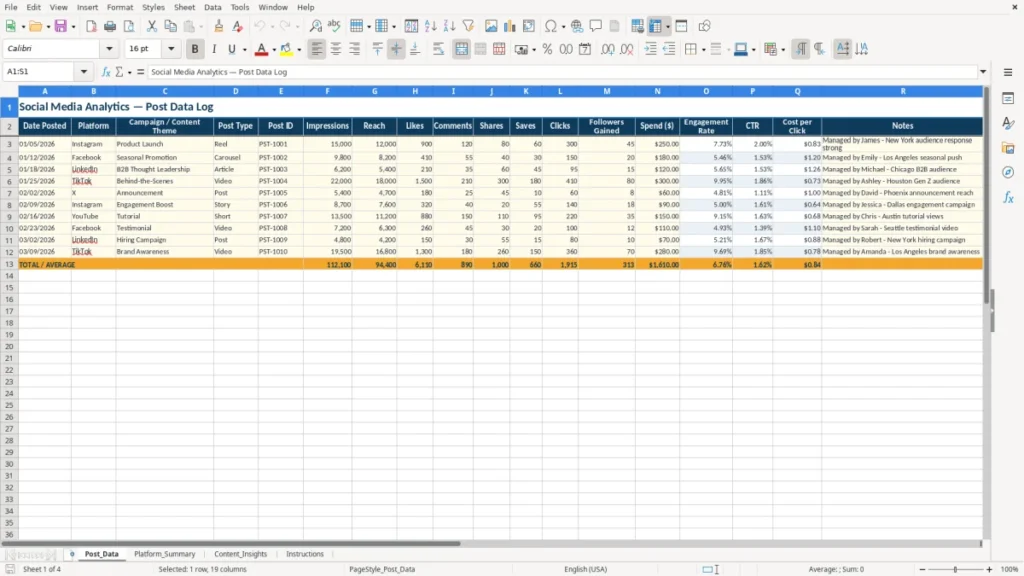
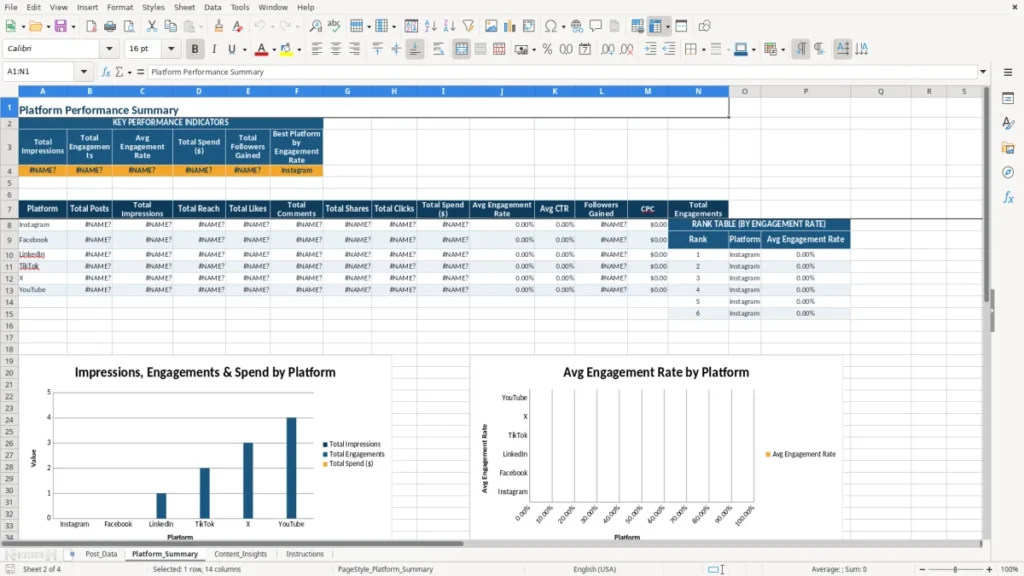
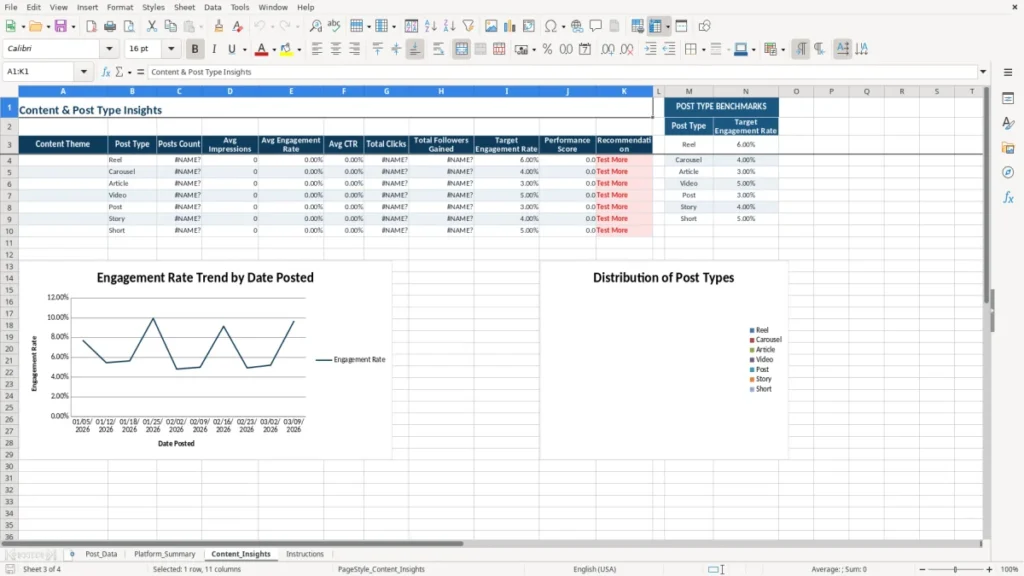
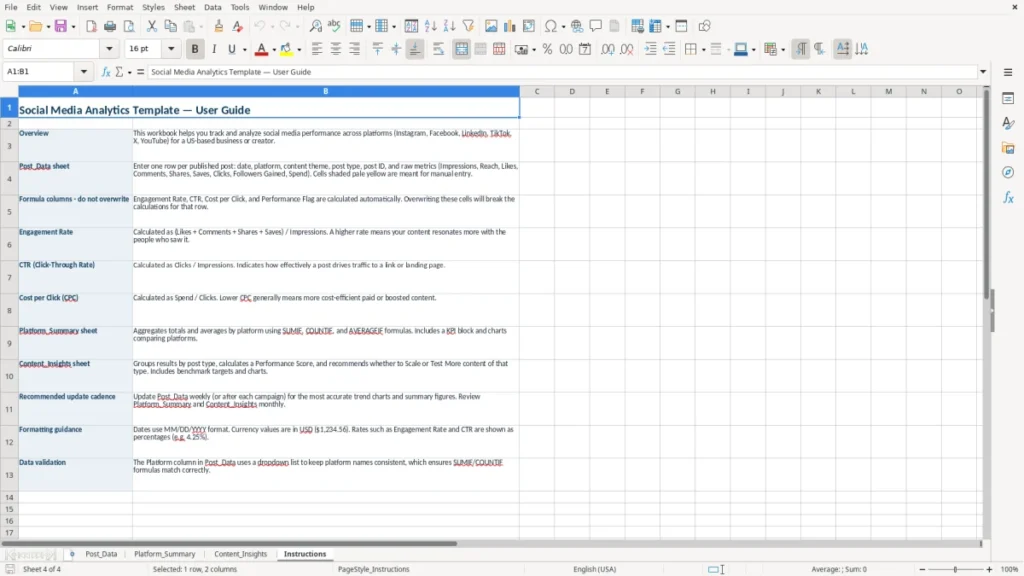
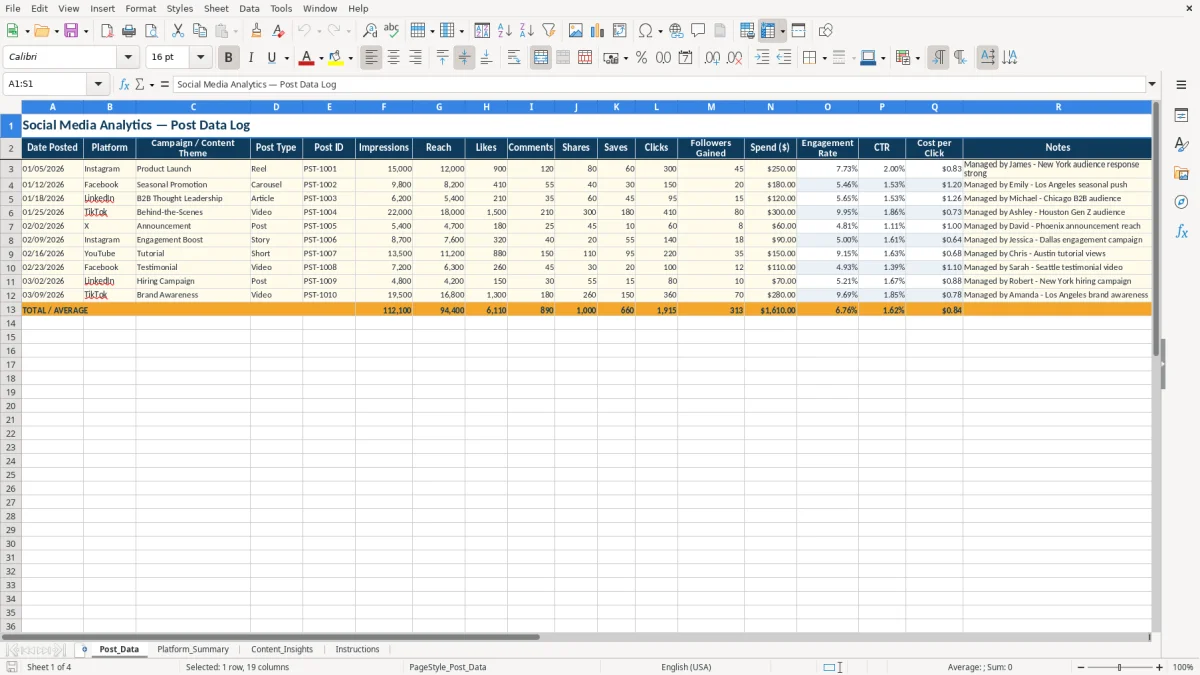
This social media analytics Excel template tracks post performance, platform totals, and content-level insights in one workbook. It includes Post_Data, Platform_Summary, Content_Insights, and Instructions sheets so you can log activity and review results fast.
Use it when you need a clean monthly reporting file for organic posts, paid campaigns, or client reporting. The workbook is built for practical metrics like impressions, reach, likes, comments, shares, saves, clicks, followers gained, spend, engagement rate, CTR, and cost per click.
It works well for a freelancer managing 12 client posts a week, an in-house marketer reviewing a $2,500 ad budget, or an agency pulling one summary before the month-end meeting. The layout keeps the input side separate from the summary side, which makes the file easier to maintain.
The main benefits of this Excel template
- Tracks post-level performance in one place, so you do not have to pull numbers from platform dashboards one by one.
- Separates input data from summary views, which makes monthly reporting easier to review and update.
- Shows engagement rate, CTR, and cost per click alongside raw counts, giving you both volume and efficiency metrics.
- Helps you compare platforms and content themes without rebuilding formulas every time.
- Makes it easier to spot weak posts early, such as a $150 boosted post with 8 clicks and a high CPC.
- Supports cleaner team handoff because the notes and performance flag fields keep context attached to each row.
- Saves time at month-end by turning 30, 60, or 300 posts into a quick summary instead of a manual recap.
Step-by-step guide
- Start on Post_Data and enter each post as a separate row. Add the date, platform, campaign theme, post type, and Post ID first so the record stays easy to sort.
- Fill in the performance numbers after the post has had time to collect results. The template is built around impressions, reach, likes, comments, shares, saves, clicks, followers gained, and spend.
- Review the calculated metrics for each post. Engagement rate, CTR, and cost per click help you compare a $40 organic post with a $400 paid post on the same basis.
- Use the notes column to capture context that numbers miss, such as a holiday promotion, a boosted reel, or a creative test that ran for 7 days.
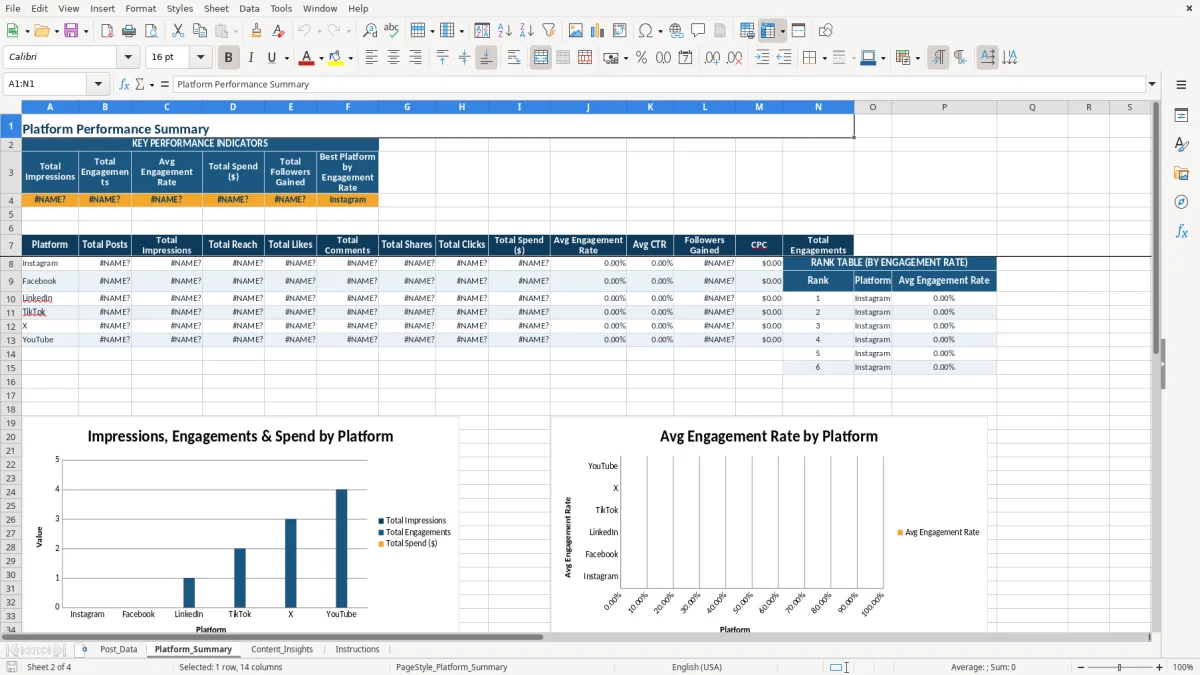
- Check Platform_Summary to see totals by channel. That is the best sheet for a weekly or monthly check-in with a client, manager, or founder.
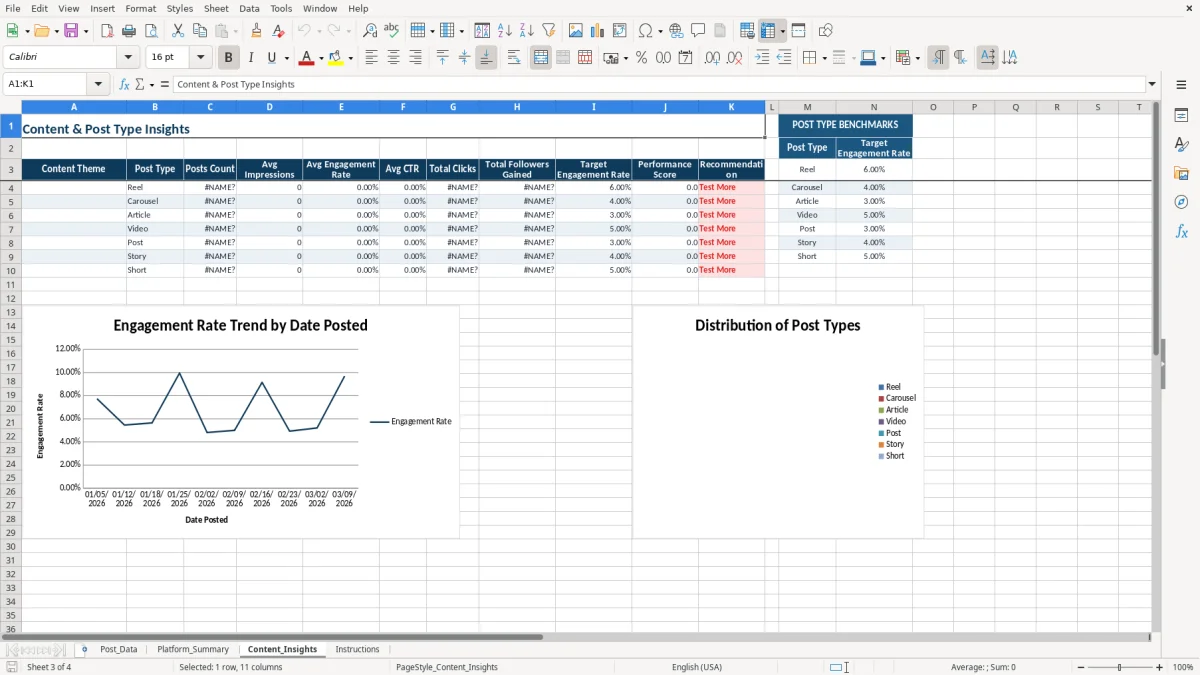
- Use Content_Insights to compare theme-level results and identify which topics bring the most clicks or followers.
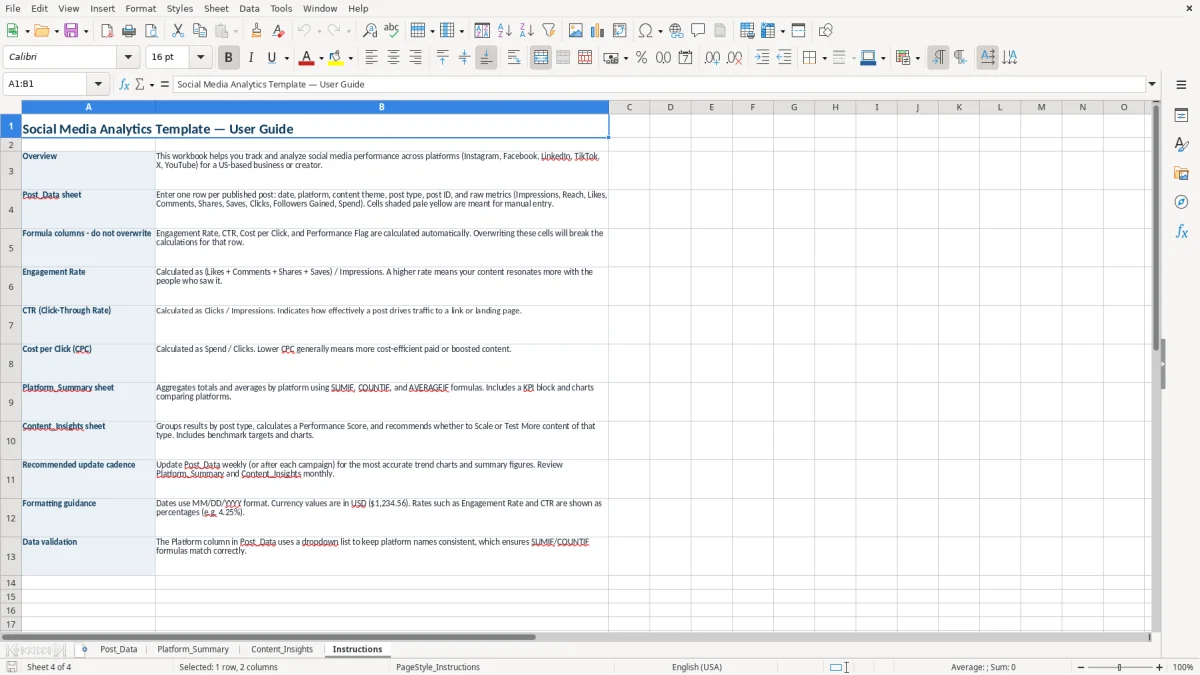
- Read the Instructions tab before you set up your own workflow, then keep the same filing pattern every week so the workbook stays current.
What is included
Post-level log with fields for date, platform, content theme, post type, and Post ID.
Core performance columns for impressions, reach, likes, comments, shares, saves, clicks, followers gained, and spend.
Calculated efficiency metrics such as engagement rate, CTR, and cost per click.
Summary sheet for platform totals, useful for comparing Instagram, Facebook, LinkedIn, TikTok, or X in one view.
Content insight sheet for theme-based analysis, so you can see which campaigns or topics actually drive results.
Dedicated instructions sheet that helps keep the workbook consistent from one reporting cycle to the next.
Notes and performance flag fields that make it easier to explain outliers, test results, and weak posts.
How marketers use an Excel template for social media reporting
If you manage content for a small business, agency, or in-house team, this workbook gives you one place to track post results without copying numbers from half a dozen dashboards. A freelancer with 8 client posts a week can log performance in under 15 minutes, while a team running 60 posts a month can use the summaries to spot what actually moved clicks and follows.
Who uses it in practice
An office manager at a contractor, a nonprofit communications lead, or a solo creator can all use the same structure. The difference is volume: one brand may log 20 posts a month, while a retail account with paid promotion may log 300 entries with spend, CTR, and notes for each test.
Why the sheet order matters
The Post_Data sheet is the input tab, Platform_Summary condenses the totals, and Content_Insights helps you compare themes instead of staring at a long list. That separation matters when you need one clean report before a Monday meeting or a month-end client call.
A simple working example
If you run 24 posts in a month and 6 of them are paid boosts at $50 each, you are tracking $300 of spend plus the organic content behind it. When one post gets 9,000 impressions and 180 clicks while the others average 2,000 impressions and 25 clicks, the summary makes the winner obvious.
What the built-in metrics and formulas tell you about performance
This template focuses on the numbers that matter most in day-to-day reporting: impressions, reach, engagement, CTR, and cost per click. In Excel, the usual approach is to calculate engagement rate as interactions divided by impressions, then compare that against spend so you can see whether a $75 post beat a $250 campaign.
Why these metrics are the right ones
Reach tells you how many people saw the content, while impressions show how often it was displayed. Likes alone do not tell you much; a post with 40 likes and 4 comments on 1,000 reach is very different from one with 40 likes and 4 comments on 20,000 reach.
Useful calculation logic
If a post has 12 clicks and $24 in spend, the cost per click is $2.00. If another post has 60 clicks and $90 in spend, its CPC is $1.50, which is usually the better result if the traffic quality is similar.
How to use the summary sheets
Platform_Summary is where you compare channel totals, and Content_Insights is where you compare themes like product launches, testimonials, or seasonal posts. That is the fastest way to decide whether to put the next $500 into a reel, a carousel, or a boosted link post.
Where social media reporting usually breaks down and what that costs
The biggest problem is inconsistent data entry. If one person enters spend as $50 and another types 50 without formatting, your totals can look fine while your cost per click is off by a factor of 100.
Bad inputs create bad decisions
A campaign with 3 posts at $100 each should show $300 in spend, not $30 or $3,000. That kind of mistake can lead you to kill a good ad too early or keep funding a weak one because the numbers make it look cheap.
Missing context is expensive too
If a boosted post launched during a holiday sale and you do not record that in Notes, you may compare it against a normal week and draw the wrong conclusion. I have seen teams waste 4 to 6 hours rebuilding a report because the original sheet had no Post ID, no dates, and no clear theme names.
Why flags and notes matter
The Performance Flag field helps you mark winners and underperformers fast, especially when you have 30 or more rows to scan. A simple label can save another hour of sorting when you need to explain why one campaign produced 140 clicks and the rest produced 20 to 40.
How to turn the spreadsheet into a weekly reporting routine
The file works best when you update it on a fixed schedule, not whenever you remember. Most teams do well with a Friday afternoon check or a month-end close routine, because that is when the post data and ad spend are easiest to gather.
Keep the routine small
- Copy the prior month’s tab structure before you start a new reporting cycle.
- Enter results in one sitting so you do not leave half-filled rows behind.
- Use the Notes column to record the reason behind outliers while the campaign is still fresh.
- Review the summary sheets right after data entry so you catch errors before you share the report.
Use Excel features that reduce cleanup
IF logic and conditional formatting are useful for performance flags, and data validation keeps platform names and content themes consistent. If you are tracking 500+ posts across several brands, or your team needs multi-user access and automated imports, that is the point where dedicated analytics software starts to make more sense than a spreadsheet.
Frequently asked questions about this template
It tracks post performance in one workbook, usually including date posted, platform, content theme, impressions, reach, likes, comments, shares, saves, clicks, followers gained, spend, and calculated metrics like engagement rate, CTR, and cost per click.
Weekly works for active accounts, and monthly works for lighter reporting. If you run 20 to 40 posts a month, a Friday update usually keeps the sheet current without turning it into a daily chore.
Yes. The spend field makes it useful for boosted posts, paid social campaigns, and organic content all in the same file, which helps you compare performance on a common basis.
Engagement rate and CTR are usually more useful than likes alone. A post with 2,000 impressions and 80 engagements tells you more than a post with 10 likes, because it shows how much of the audience actually reacted.
When you have hundreds of posts, several people entering data, or automated pulls from ad platforms, the manual copy-and-paste process gets slow and error-prone. At that point, reporting software or a dashboard tool is usually the better fit.
Record anything that explains performance, such as a holiday promotion, a giveaway, a boosted post, a creative test, or an unusual event on the brand side. That context makes the numbers easier to interpret later.
Meet the makers