
Project & Planning


Continuous Improvement Excel - Free Template
Track improvement initiatives, owners, deadlines, status, targets, savings, and impact scores in a practical Excel workbook for small teams.
2026-07-15
233 downloads
4.8/5
Download template
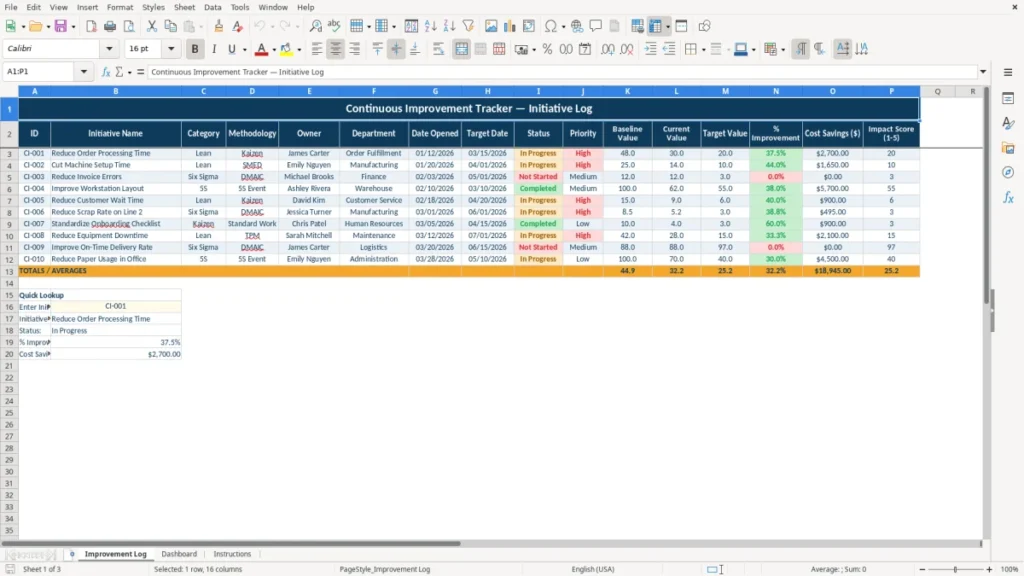
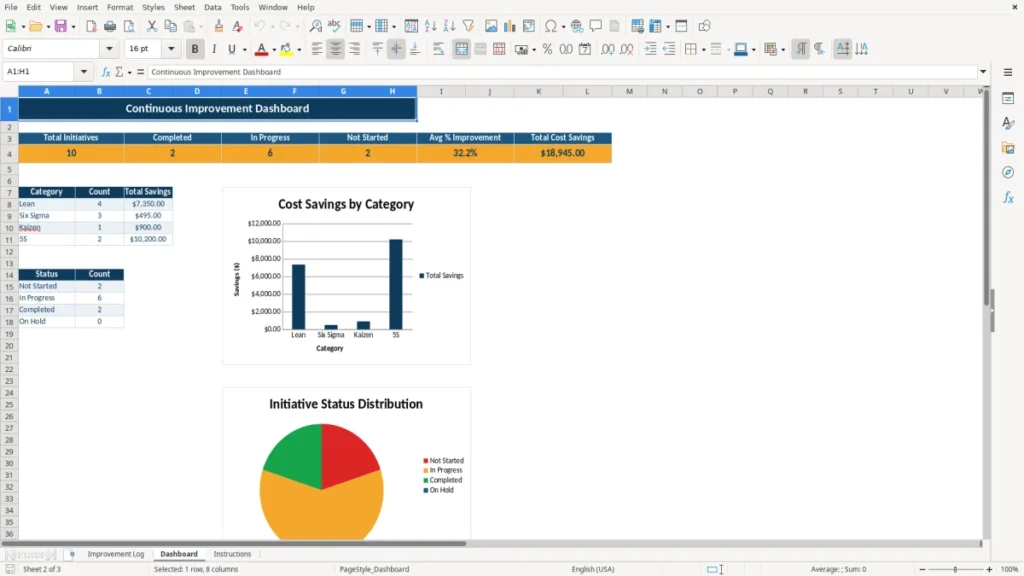
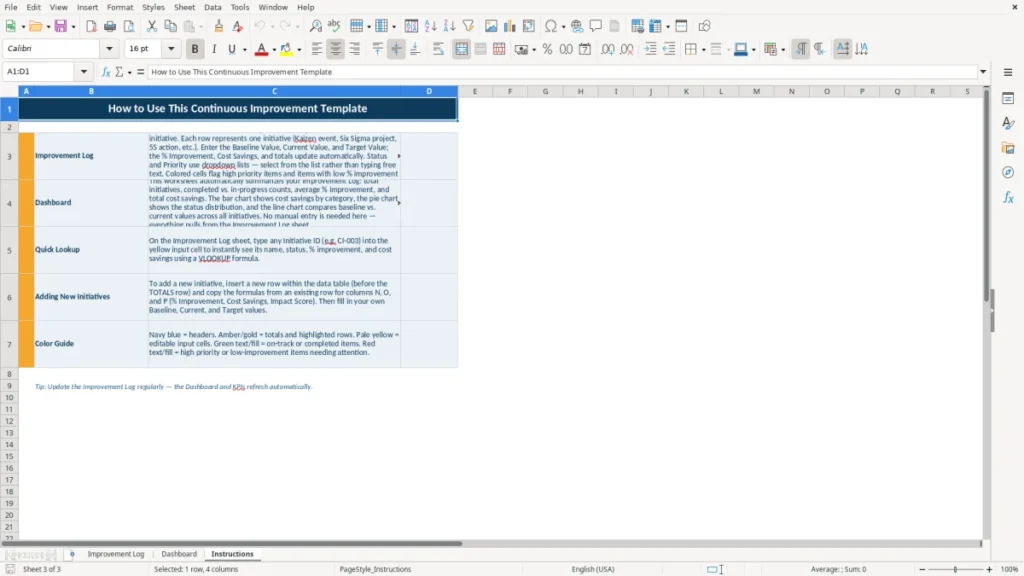
This continuous improvement Excel template records process initiatives from opening through completion. It includes an Improvement Log with 16 tracking columns, a Dashboard for monitoring results, and an Instructions sheet explaining how to maintain the workbook.
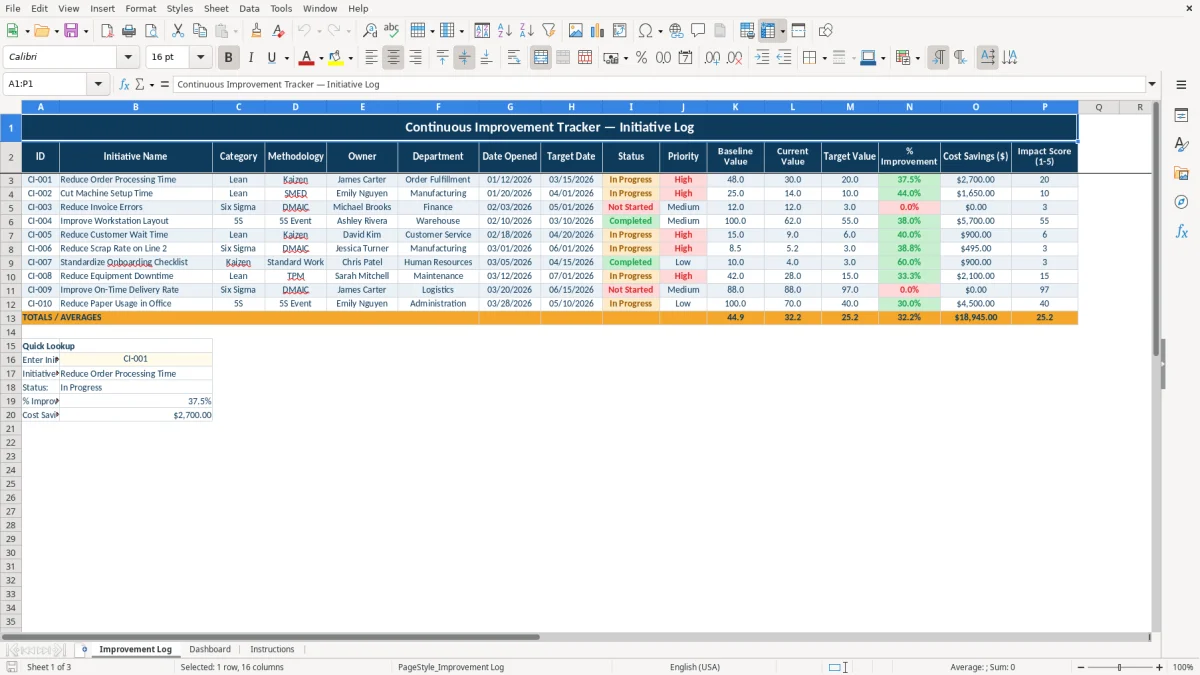
Use it to give every improvement effort an owner, department, methodology, target date, measurable baseline, and current result. Image 1 shows the Improvement Log with yellow input cells, navy headers, and room for initiative-level tracking.
The layout works for a contractor, nonprofit, manufacturer, service business, or office team that needs a visible record of small operational changes instead of scattered notes and email threads.
The main benefits of this Excel template
- Track each initiative with a unique ID such as CI-001 instead of relying on project names alone.
- Compare baseline, current, and target values so progress is measurable rather than subjective.
- Assign an owner, department, target date, status, and priority to every improvement action.
- Record cost savings in dollars and an impact score from 1 to 5 for practical prioritization.
- Separate improvement work by category and methodology, such as 5S, Kaizen, Lean, or Six Sigma.
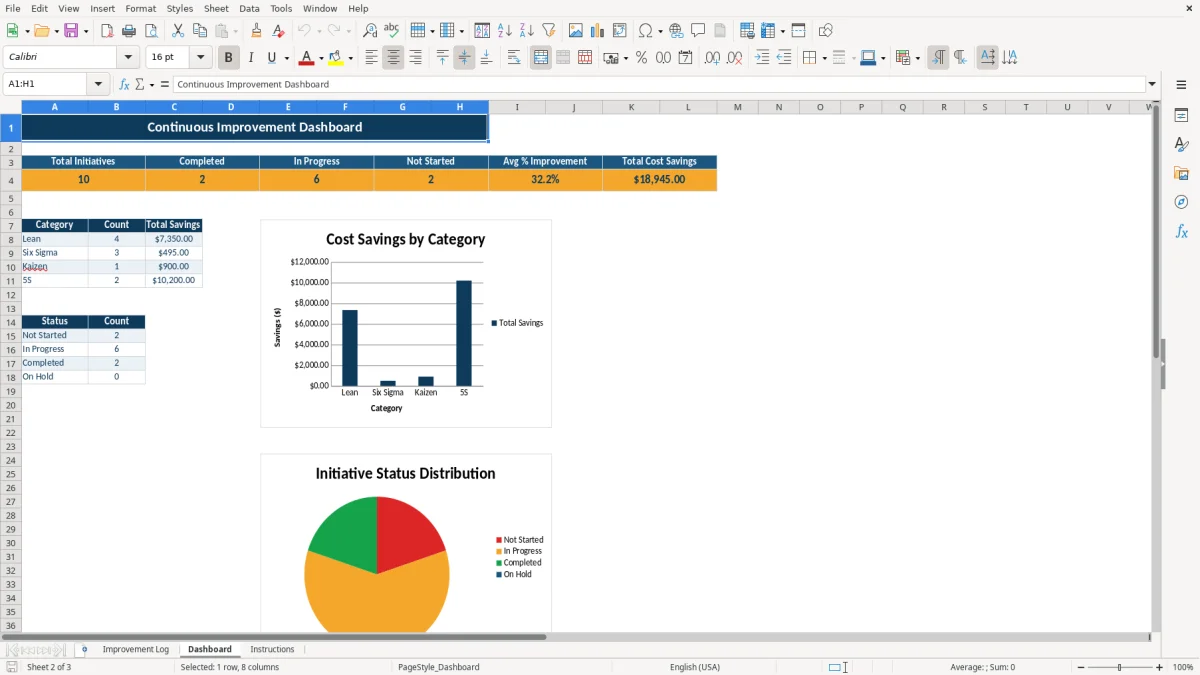
- Use the Dashboard to review the portfolio without sorting the full 16-column log manually.
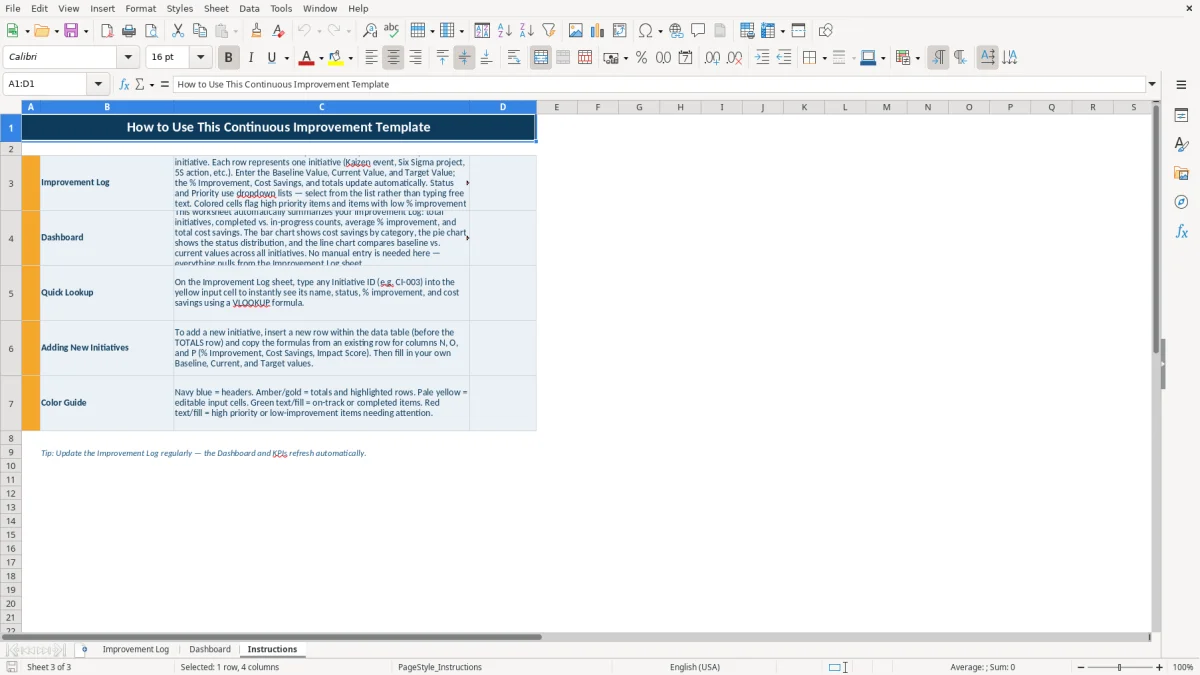
- Keep entry guidance in the Instructions sheet so a new coordinator can update the workbook consistently.
Step-by-step guide
- Open the Instructions sheet first and review the intended meaning of each field before entering initiatives.
- Go to Improvement Log and give the first project an ID, initiative name, category, methodology, owner, and department.
- Enter the Date Opened and Target Date, then select the current Status and Priority used by your team.
- Record the Baseline Value, Current Value, and Target Value using the same unit—for example, minutes per order or defects per 100 units.
- Enter the estimated or confirmed Cost Savings ($) and assign an Impact Score from 1 to 5 based on the initiative's business effect.
- Review the Dashboard during your weekly improvement meeting, then update the log when a result, owner, status, or deadline changes.
What is included
Improvement Log with ID, initiative name, category, methodology, owner, and department fields.
Date Opened and Target Date columns for managing the improvement timeline.
Status and Priority fields that make open work easier to review during a team meeting.
Baseline Value, Current Value, and Target Value columns for a three-point performance comparison.
% Improvement and Cost Savings ($) fields for quantifying operational results.
Impact Score (1-5) for ranking initiatives by expected or observed value.
Dashboard and Instructions sheets that support portfolio review and consistent data entry.
Who uses continuous improvement tracking in the United States
Continuous improvement tracking is useful whenever several small process changes compete for attention. An office manager at a contractor may use it for estimating, purchasing, field scheduling, and invoice follow-up; a warehouse supervisor may track picking accuracy and receiving delays; a nonprofit treasurer may document improvements to donor reconciliation before the annual close.
A four-employee contractor, for example, might open CI-001 to reduce the time needed to turn a signed estimate into a work order. The owner could record a baseline of 48 hours, a current result of 31 hours, and a target of 24 hours, then assign the office manager as owner and the administration department as the accountable area.
When the log earns its place
The best time to update the file is during a fixed weekly operations meeting, not only after a project is finished. A team with 12 active initiatives can spend 15 minutes reviewing dates, status, and current values instead of reconstructing progress from six email chains.
Use the Improvement Log at the start of a project to define the problem and again at completion to capture the result. Image 1 shows the 16-column structure: the identifying and ownership fields come first, followed by dates, control fields, measurements, savings, and impact.
Different teams, one measurement discipline
The same workbook can support a 300-order-per-month online store, a repair shop, or a back-office team. The category and methodology explain what kind of change is being tested, while the three value columns preserve the before-and-after evidence.
For example, a store might measure picking errors per 100 orders, while an office measures invoice processing days. My preference is to track one primary unit per initiative; combining dollars, hours, and error percentages in one measurement field makes the dashboard difficult to interpret.
How to measure improvement without corrupting the Excel data
The workbook is a management tracker, not a substitute for a formal quality-management system. It works best when each initiative has one clearly defined metric and the baseline, current, and target values use the same unit and measurement period.
Choose a defensible baseline
Use a representative starting period rather than the single worst day. If an online store processed 300 orders in a month and 18 required a correction, the baseline could be 6 defects per 100 orders. A target of 3 defects per 100 orders is meaningful; a target of zero may not be credible without evidence.
For a time-based project, a reduction from 48 hours to 31 hours is a 35.4% improvement when calculated as (48 - 31) / 48. Be precise about direction: lower processing time is better, but higher completed orders per employee may be better. Record the values consistently before comparing them.
Use methodology and ownership as controls
The Methodology field can identify a structured approach such as Kaizen, Lean, 5S, or Six Sigma. This is more useful than entering a vague label such as process project because it tells the reviewer how the change was approached.
Cost Savings ($) should be supported by a calculation outside or inside your normal records. If a change saves 2 labor hours per week at a loaded cost of $28 per hour, the annualized estimate is $2,912 using 52 weeks. Mark the figure as an estimate in your team notes until the saving appears in actual results.
Impact Score (1-5) is a judgment field, so define the scale in the Instructions sheet for your team. A practical scale might treat 1 as minor inconvenience and 5 as a material customer, safety, compliance, or cash-flow effect. Do not let a high score replace a measurable result.
Where improvement programs lose money and credibility
The most expensive failure is not an incomplete spreadsheet; it is a claimed improvement that nobody can reproduce. I have seen teams report a 20-minute time reduction after measuring the old process during a rush week and the new process during a quiet week. The dashboard looked successful, but the comparison was not valid.
Mixed units create false progress
One initiative may begin with 48 hours, switch to 31 hours, and finish with a target written as 90 percent. That mixes elapsed time with a percentage and prevents a sensible comparison. Keep all three value fields in hours, dollars, units, or another single measure, and put the percentage goal in a separate team convention.
A second problem is changing the definition midway through the project. If defects originally mean customer corrections but later include internal formatting changes, a reported drop from 18 to 9 defects may reflect reclassification rather than better work.
Ownership gaps delay the result
An initiative without a named Owner usually becomes everybody's responsibility and therefore nobody's deadline. A four-person contractor can lose two hours each week chasing updates; at a loaded labor cost of $28 per hour, that is about $2,912 over a year.
Another common breakdown is leaving the Target Date in place after the deadline passes. That hides overdue work and weakens the weekly review. Treat a missed date as a management signal: revise the date with a reason, close the initiative with its actual result, or mark it as stopped rather than quietly carrying it forward.
Savings are overstated
Annualizing every small time saving is a reliable way to inflate the portfolio. Saving 10 minutes on a task performed twice a month is not the same as saving 10 minutes on 300 orders each month. Calculate frequency first, use the Cost Savings ($) field conservatively, and separate hard cash reductions from capacity that merely becomes available for other work.
When several initiatives are running at once, a project status report keeps those cost savings tied to actual progress instead of inflated portfolio totals.
How to make the improvement log part of your weekly routine
A tracker becomes useful when updating it is attached to a meeting that already happens. Put the Improvement Log on the agenda for a 20-minute Friday operations review, or review it immediately after the weekly production, payroll, or accounts-receivable meeting so the file is not treated as a separate administrative project.
Use a short review sequence
- Start with initiatives whose Target Date is within the next 14 days.
- Ask each Owner for one updated Current Value, one obstacle, and one next action.
- Review high-priority items before low-impact cleanup projects.
- Close only initiatives with a recorded result, not merely a completed meeting.
For example, if a department has 10 open initiatives and three are due within 14 days, review those three first. That is more useful than spending the meeting alphabetizing all 10 names.
Keep entries consistent
Use the same department names and methodology labels every time. If one person enters Operations, another enters Ops, and a third enters Field Operations, the Dashboard may split what should be one group. Copy an existing row's wording when a new initiative uses the same category.
Keep the source workbook in a shared location with a simple naming convention such as Continuous Improvement Tracker - Current. Save a dated backup at month-end, especially before changing completed results or cost estimates.
Know when Excel is no longer enough
This template is a sensible choice for a small team with fewer than about 50 active initiatives and one person responsible for updates. Move to dedicated workflow or quality software when you need audit trails, simultaneous editing controls, automated assignments, approval history, or more than 10,000 records.
At that point, a strategy planning template fits the same scale limits while giving you a more structured way to handle larger initiative lists.
Frequently asked questions about this template
It is a workbook for recording process-improvement initiatives, owners, dates, status, priorities, measurements, savings, and impact. This file includes Improvement Log, Dashboard, and Instructions sheets.
The log contains ID, Initiative Name, Category, Methodology, Owner, Department, Date Opened, Target Date, Status, Priority, Baseline Value, Current Value, Target Value, % Improvement, Cost Savings ($), and Impact Score (1-5).
A small business owner, office manager, department supervisor, nonprofit treasurer, warehouse lead, or operations coordinator can use it to manage improvement work without specialized quality software.
Use the same unit for all three values. For example, enter 48, 31, and 24 when tracking processing hours, or enter 6, 4, and 3 when tracking defects per 100 orders.
Update it at least weekly for active initiatives. A fixed Friday review or an update immediately after an operations meeting keeps owners, dates, status, and Current Value fields from becoming stale.
Excel is usually practical for a small team with fewer than about 50 active initiatives. Consider workflow or quality software when you need approval history, audit trails, automated assignments, controlled simultaneous editing, or more than 10,000 records.
Meet the makers