
Personal Finance


Financial Budget Excel - Free Template
Track income, expenses, planned amounts, actual spending, variances, savings rate, and monthly cash flow for a household or small business.
2026-09-10
384 downloads
4.8/5
Download template
A financial budget Excel template is a spreadsheet for recording income and expenses, comparing budgeted amounts with actual results, and reviewing cash flow. This workbook contains a Budget Detail entry sheet, a Budget Summary dashboard with category and monthly analysis, and an Instructions sheet.
Enter transactions in the yellow cells on Budget Detail. The workbook calculates the month, variance, and Under Budget or Over Budget status, while Budget Summary uses SUMIFS, COUNTIF, VLOOKUP, and AVERAGE formulas to consolidate the figures.
The layout works for a household, freelancer, or small business cash plan. It includes room for 100 transaction rows, standard categories such as Housing, Utilities, Groceries, Transportation, Insurance, Savings, and Other, plus two summary charts.

The main benefits of this Excel template
- Record up to 100 prepared transaction rows with date, type, category, description, payee or source, payment method, budgeted amount, actual amount, and notes.
- Compare every planned amount with actual income or spending through an automatic dollar variance.
- See whether each populated transaction is Under Budget or Over Budget without manually reviewing the arithmetic.
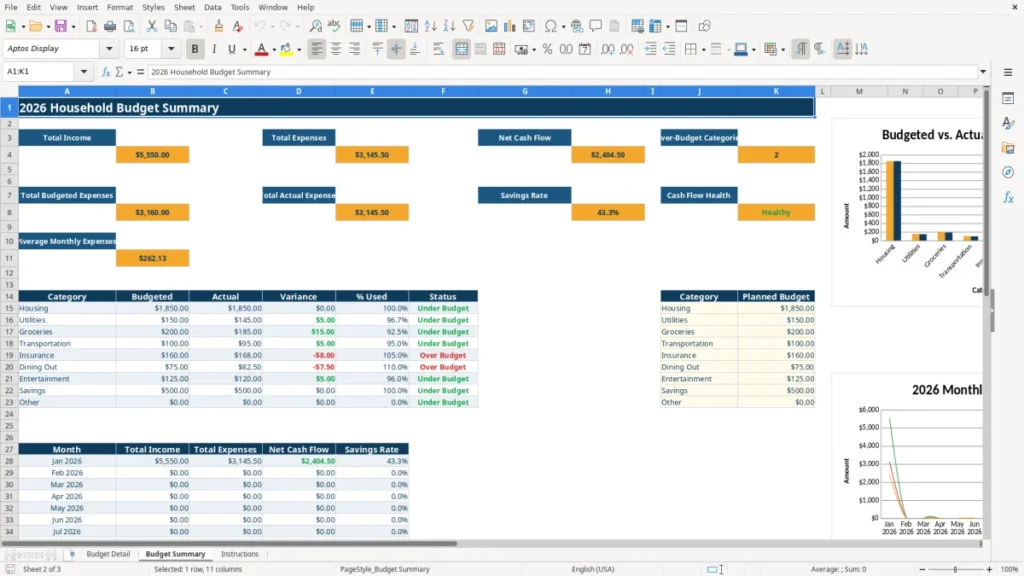
- Summarize total income, total expenses, net cash flow, budgeted expenses, actual expenses, savings rate, and average monthly expenses.
- Review category-level budget, actual, variance, percentage used, and status for nine expense categories.
- Identify the number of over-budget categories and receive a Healthy or Review Needed cash flow indicator.
- Analyze monthly income, expenses, and variance across the 12-month summary section with two built-in charts.
Step-by-step guide
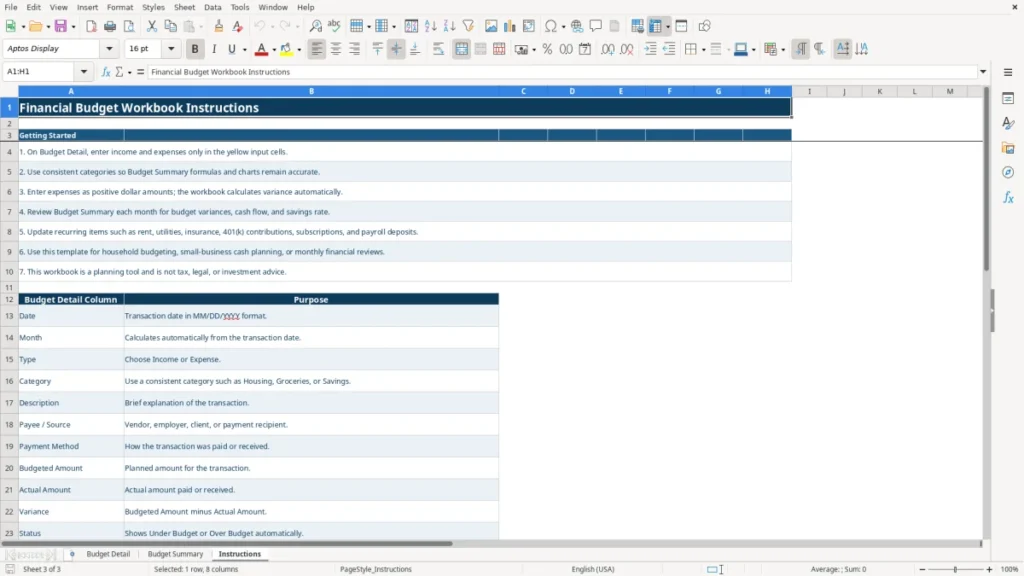
- Open the Instructions sheet first. It explains the purpose of each Budget Detail column and identifies the role of all three sheets.
- Go to Budget Detail and enter transactions in the yellow input cells. Use dates in MM/DD/YYYY format and enter income and expenses as positive dollar amounts.
- Select Income or Expense in the Type column, then choose a consistent Category and Payment Method from the available drop-down lists.
- Enter the planned figure in Budgeted Amount and the amount actually received or paid in Actual Amount. Add a description, payee or source, and optional note so the transaction can be identified later.
- Leave Month, Variance, and Status alone. Month is derived from Date, while Variance calculates Budgeted Amount minus Actual Amount and Status identifies the result.
- Open Budget Summary after entering or updating transactions. Review the headline figures, category comparison, monthly trend area, over-budget count, and cash flow health result.
- Update recurring items such as rent, utilities, insurance, subscriptions, payroll deposits, or 401(k) contributions during each monthly review, and save the completed workbook with your other financial records.

What is included
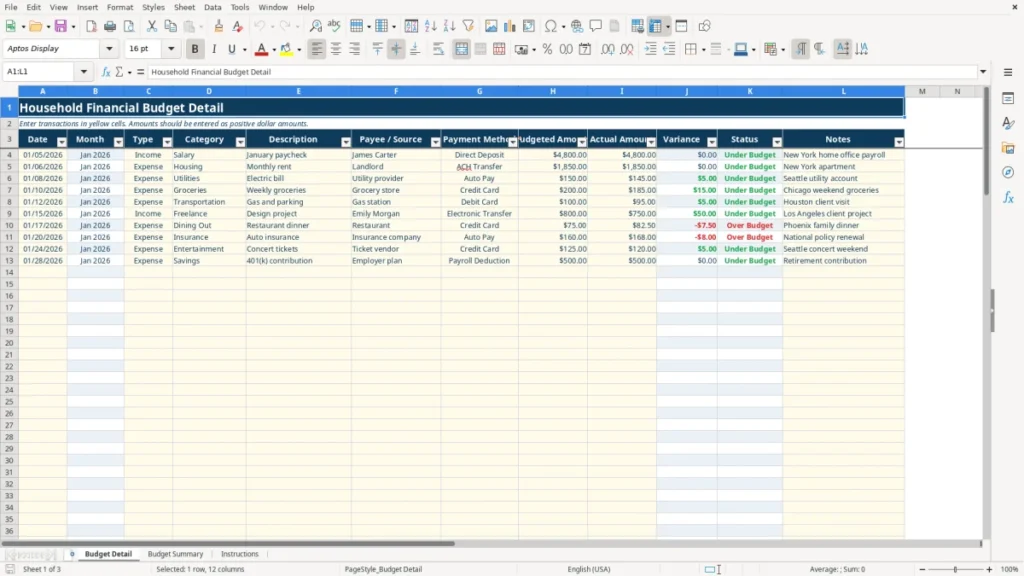
Budget Detail has columns for Date, Month, Type, Category, Description, Payee / Source, Payment Method, Budgeted Amount, Actual Amount, Variance, Status, and Notes.
The Type, Category, and Payment Method columns use drop-down validation to keep entries consistent across the summary formulas.
Budgeted Amount and Actual Amount accept nonnegative decimal values, with currency formatting shown as $1,234.56.
The Month column uses IF and TEXT to display labels such as Jan 2026 from the transaction date.
The Budget Summary calculates totals with SUMIFS, category results with VLOOKUP and SUMIFS, and over-budget counts with COUNTIF.
The summary includes category and monthly comparison charts based on the populated summary ranges.
Freeze panes, an auto-filter, conditional formatting, and the Instructions sheet make the 100-row entry area easier to review.
Who uses a financial budget Excel template during the year
A household uses this financial budget Excel template when paychecks, rent, bills, groceries, and savings contributions need to be judged against a plan. A two-income household might budget $6,800 of monthly income, $1,850 for housing, $500 for savings, and $3,950 for all other expenses. Entering each transaction on Budget Detail shows whether the plan still works after the electric bill or grocery spending changes.
A freelancer operating as a sole proprietorship can use the same layout for monthly cash planning, even though it is not a tax return or formal bookkeeping ledger. For example, a designer receiving $7,500 from three clients could enter each client payment as Income and record software, insurance, dining, transportation, and savings as Expense rows. The Payee / Source and Notes columns preserve enough context for a monthly review.
At the start of a month
Enter recurring planned items before the first payroll deposit or client payment. Rent of $1,850, insurance of $160, a $500 savings transfer, and a $200 grocery plan give you a working baseline rather than a vague target. The prepared rows run from row 4 through row 103, so the workbook has space for 100 transactions.
During the weekly review
Enter actual amounts as transactions occur instead of waiting until year-end. A contractor's office manager, a household member, or an LLC bookkeeper can filter Budget Detail by date, Type, or Category and then compare the result with Budget Summary. Image 1 shows the detailed entry layout, including the 12 columns, yellow input cells, automatic Month, Variance, and Status fields, frozen top rows, and the A3:L103 filter area.
At month-end, the Budget Summary gives a faster decision view. Image 2 shows total income, total expenses, net cash flow, savings rate, over-budget categories, category comparisons, monthly results, and the two charts. Image 3 shows the written instructions and column guide for anyone else entering the file.

How the budget workbook fits US tax and recordkeeping rules
This workbook is a planning tool, not a substitute for a tax ledger, payroll system, or tax filing. A US freelancer generally reports business income and deductible expenses on Schedule C, and self-employment tax is 15.3% before applicable wage-base and income details: 12.4% Social Security plus 2.9% Medicare. The workbook can help you spot cash movement, but its categories do not establish tax deductibility.
If your estimated federal tax requires payments, individuals commonly use Form 1040-ES and the quarterly due dates of April 15, June 15, September 15, and January 15 of the following year. A practical example is a freelancer expecting $80,000 of net profit who sets aside 25%, or $20,000, in a separate tax reserve. Entering that transfer as Savings can show the cash effect, but the tax calculation still requires taxable-income analysis.
Keep source records beside the spreadsheet
The IRS generally expects supporting records to be retained for three years after a return is filed, with longer periods applying to some property, loss, or omitted-income situations. Preserve bank statements, receipts, invoices, payroll reports, and payment confirmations; a note saying $240 groceries is not the same as a receipt or bank record.
Separate planning from compliance
An LLC may be taxed as a sole proprietorship, partnership, or corporation, while an S-corp must handle reasonable compensation and payroll. Employee wages require a W-2, while qualifying independent contractor payments may require Form 1099-NEC; the budget file does not determine worker classification. If an employer has four employees earning $3,200 each in a month, $12,800 of gross wages is only one part of payroll cost because employer FICA, unemployment taxes, benefits, and withholding administration also matter.
Sales tax is another separate obligation: rates and filing rules are imposed by states and local jurisdictions, while Alaska, Delaware, Montana, New Hampshire, and Oregon do not impose a general state sales tax. Use the workbook to plan the cash payment, but maintain the transaction-level tax detail required by the applicable state.
Where financial budgets break down and what it costs
The most expensive mistake is entering only the large bills. A household that records $1,850 rent but misses $14 coffee purchases three times a week has omitted roughly $168 per month. Over 12 months, that is about $2,016 of spending that never appears in the budget, making the apparent savings rate look better than reality.
Another failure is mixing planned and actual figures in one column. If a $200 grocery plan is overwritten with the $247.35 card charge, the original target disappears and the $47.35 overspend cannot be measured. Keep Budgeted Amount at $200 and enter $247.35 in Actual Amount; the workbook then calculates a -$47.35 variance and marks the row Over Budget.
Inconsistent categories distort the summary
The summary formulas match the exact category labels supplied by the workbook. If one transaction is entered as Groceries and another as Grocery, the second row will not be included in the Groceries category result. A $600 annual mismatch spread across similar labels can make the category chart and percentage-used calculation misleading even though every individual transaction looks reasonable.
Negative entries reverse the intended logic
The Instructions sheet says to enter expenses as positive dollar amounts. If a $150 utility expense is entered as -$150, total expenses fall by $150 instead of increasing by $150, and net cash flow rises by $300 compared with the intended result. The decimal validation prevents nonnumeric entries, but it does not decide whether a sign makes business sense.
Skipping the summary wastes the control
Entering transactions without reviewing Budget Summary leaves the most useful warning unread. Suppose planned expenses total $3,000, actual expenses reach $3,450, and income is $4,000: net cash flow is $550, but the $450 overspend still needs attention. The category Status column and over-budget count show where that difference occurred.
Do not use a populated sample row as a permanent business fact. Replace the example names, locations, and amounts with your own records; otherwise a January paycheck or New York rent figure can remain in the totals and distort the year.
How to make the budget a reliable monthly routine
A spreadsheet becomes useful when it is attached to an existing event. Set a 20-minute review immediately after the last monthly bank transaction clears, or pair it with the payroll run for a small business. During that appointment, enter missing actuals, check the summary, and decide what changes before the next pay period.
Use a short repeatable process
- Start with the bank or credit-card statement and enter transactions in date order rather than relying on memory.
- Check that every row has a Type, Category, Budgeted Amount, and Actual Amount before reading the totals.
- Review each Over Budget result and write a useful explanation in Notes, such as a car repair or annual insurance renewal.
- Compare the savings rate and net cash flow with the amount you intended to retain, not just with the previous month.
For a household with 35 transactions per month, this routine usually takes less time than reconstructing three months at once. A small business with 80 entries can split the work into a weekly 10-minute update and a longer month-end review. Image 1's filter and frozen header help you find incomplete or unusual rows without scrolling blindly.
Protect the formulas
Enter data only in the yellow cells and leave Month, Variance, Status, and Budget Summary formulas intact. Use the drop-down values exactly as provided; changing Housing to Home or Direct Deposit to Deposit breaks the consistency that the SUMIFS and lookup formulas rely on. Save a dated copy after each closed month, such as Budget-January-2026.xlsx, so a later correction does not erase the prior review.
Know when Excel is no longer enough
This workbook is a good fit for 100 or fewer transaction rows and a focused monthly plan. Move to accounting software when you need bank feeds, reconciled accounts, invoices, bills, payroll filings, user permissions, an audit trail, or more than 100 recurring entries; those controls are not included in this file.
Frequently asked questions about this template
It tracks income and expenses by date, month, type, category, description, payee or source, payment method, budgeted amount, actual amount, variance, status, and notes. The Budget Summary also tracks total income, total expenses, net cash flow, savings rate, category performance, and monthly results.
Budget Detail has prepared operational rows 4 through 103, providing space for 100 transactions. The workbook does not include an Excel table or automatic row expansion, so do not assume that entries beyond row 103 will flow into the summary formulas.
Enter information in the yellow input cells on Budget Detail. Use Date, Type, Category, Description, Payee / Source, Payment Method, Budgeted Amount, Actual Amount, and Notes; leave Month, Variance, and Status as calculated outputs.
Variance equals Budgeted Amount minus Actual Amount. If the budget is $200 and actual spending is $247.35, the result is -$47.35 and Status displays Over Budget. A positive or zero variance displays Under Budget.
No. It is a cash-planning workbook for household budgeting, small-business planning, or monthly financial reviews. It does not prepare a tax return, calculate payroll taxes, reconcile bank accounts, issue a W-2 or 1099, track depreciation, or provide an audit trail.
The summary uses exact category labels and includes Housing, Utilities, Groceries, Transportation, Insurance, Dining Out, Entertainment, Savings, and Other. Select the matching drop-down value in Budget Detail; a variation such as Grocery instead of Groceries will not match the summary formula.
Meet the makers