
Project & Planning


ISO 9001 Risk Assessment Excel - Free Template
ISO 9001 risk register with likelihood, severity, controls, mitigation, residual scoring, dashboard, and instructions for quality teams.
2026-07-26
295 downloads
4.8/5
Download template
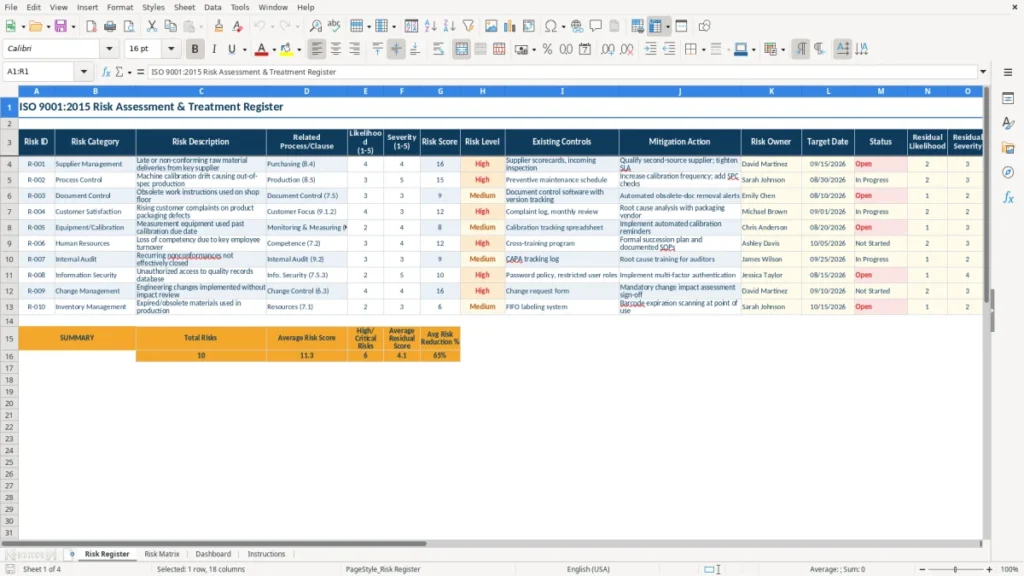
This ISO 9001 risk assessment Excel template records process risks, related clauses, likelihood, severity, controls, mitigation actions, owners, dates, and status. It calculates initial and residual risk scores and presents the results in a risk matrix and dashboard, giving you a practical register for quality reviews and audit preparation.
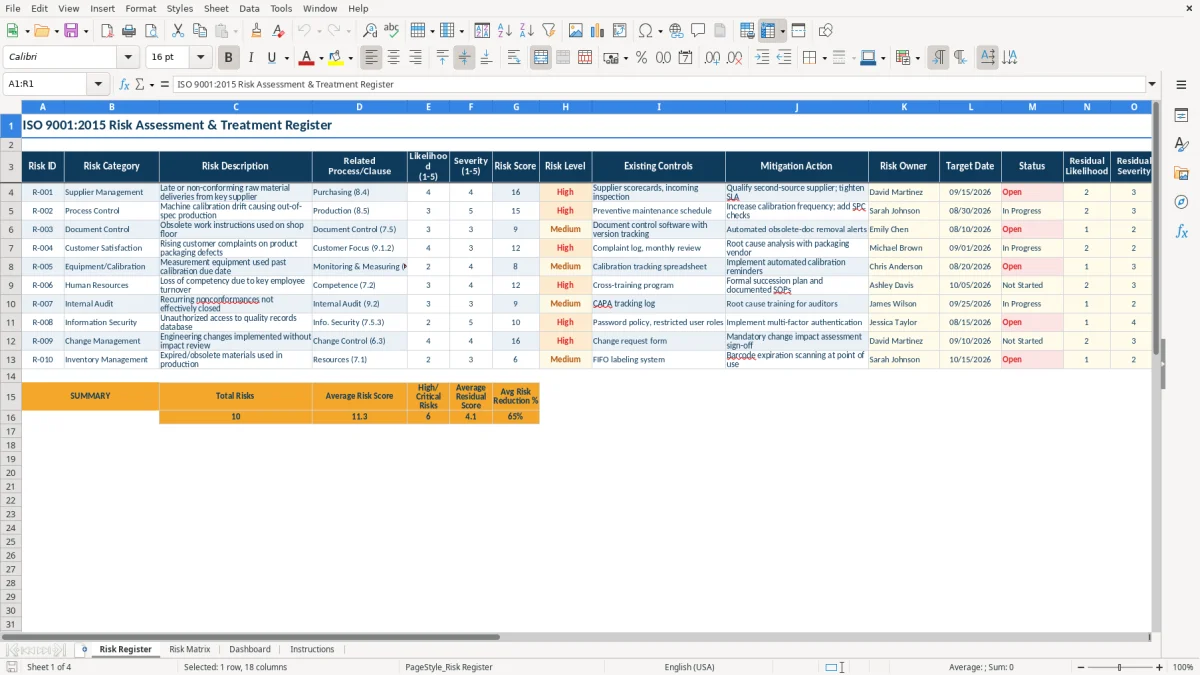
The Risk Register sheet (image 1) has 18 columns, from Risk ID and Risk Category through Residual Level and Risk Reduction %. Yellow input cells distinguish information you enter from calculated risk results, while the navy headers keep a wide register readable.
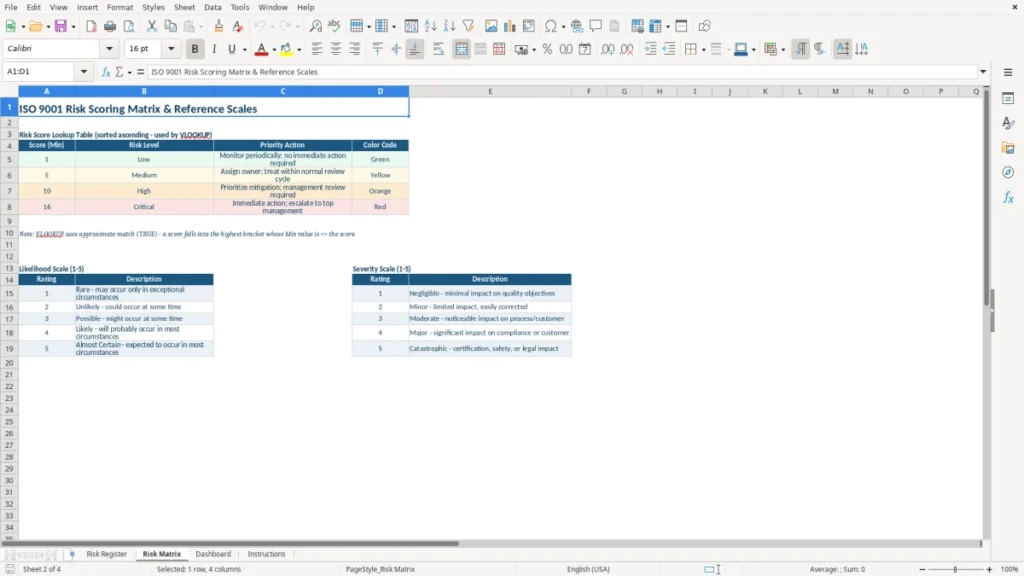
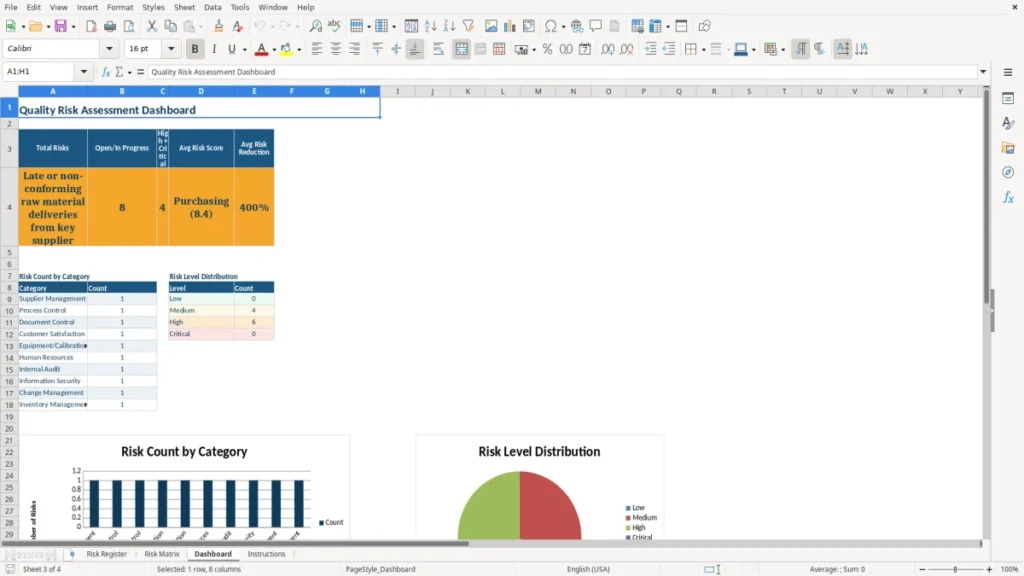
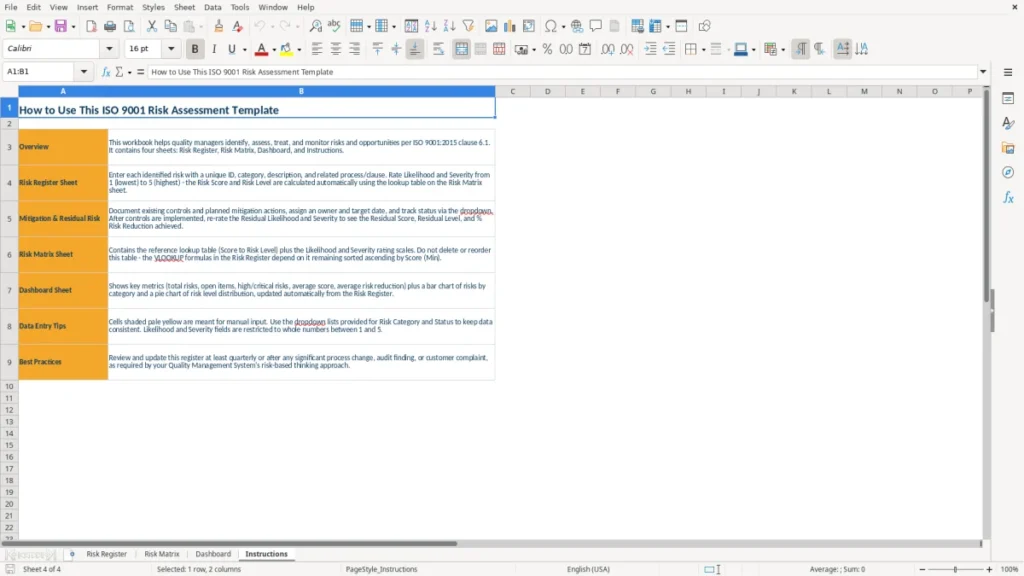
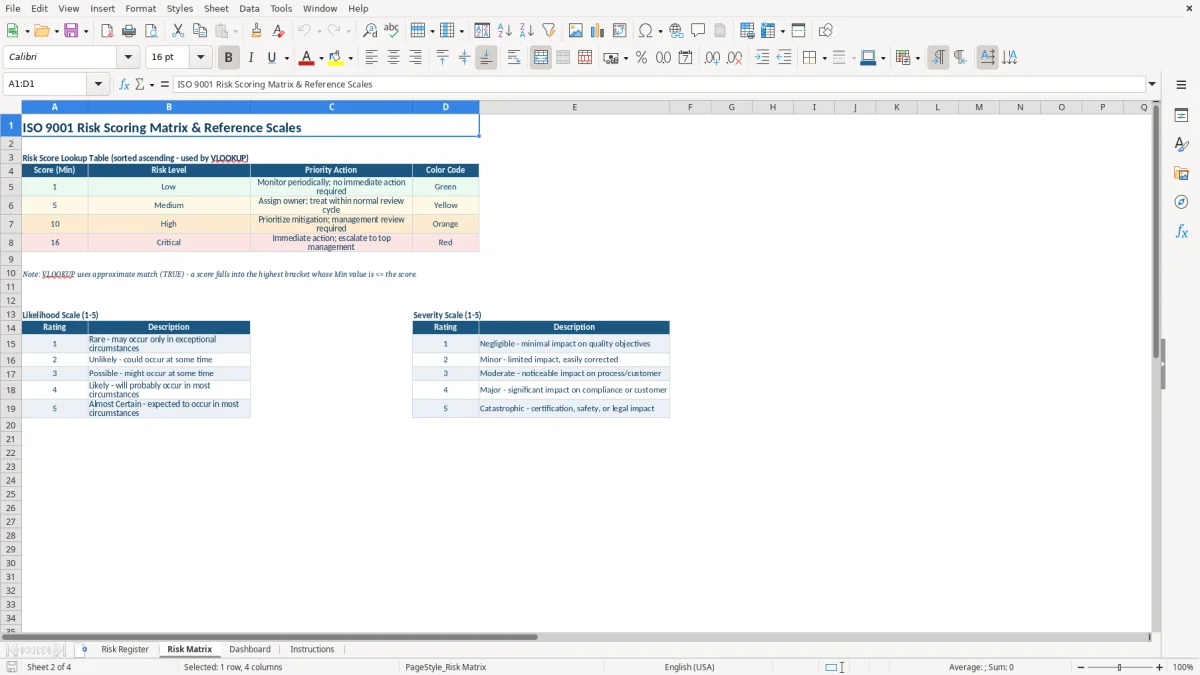
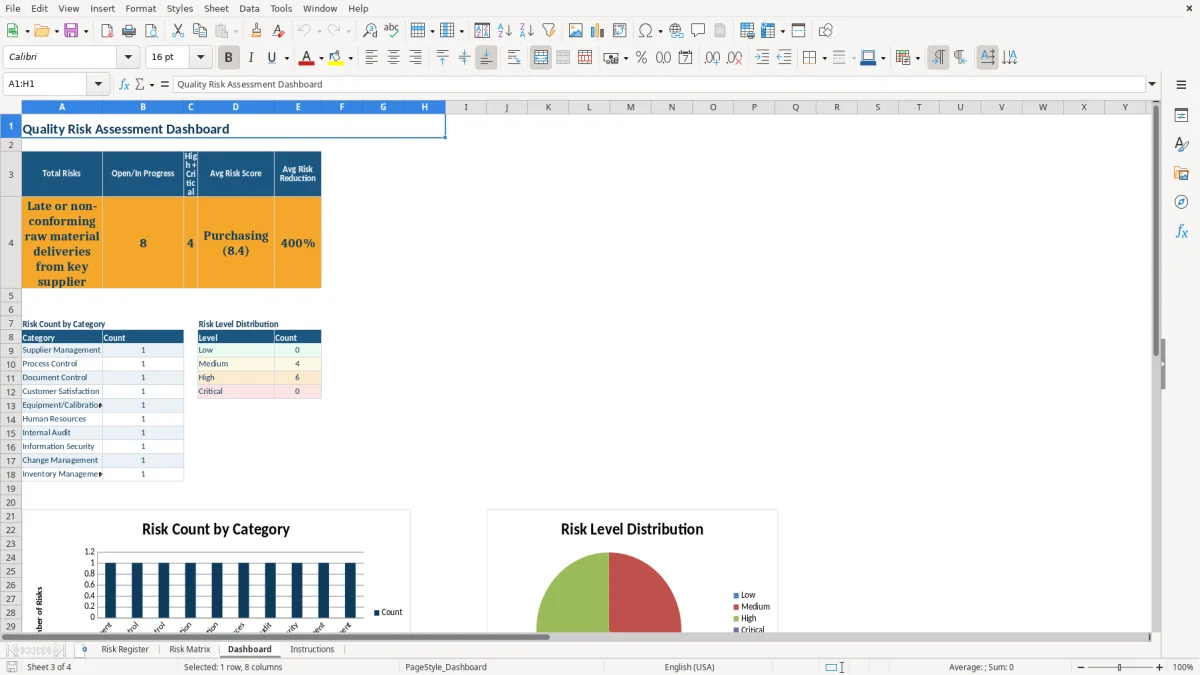
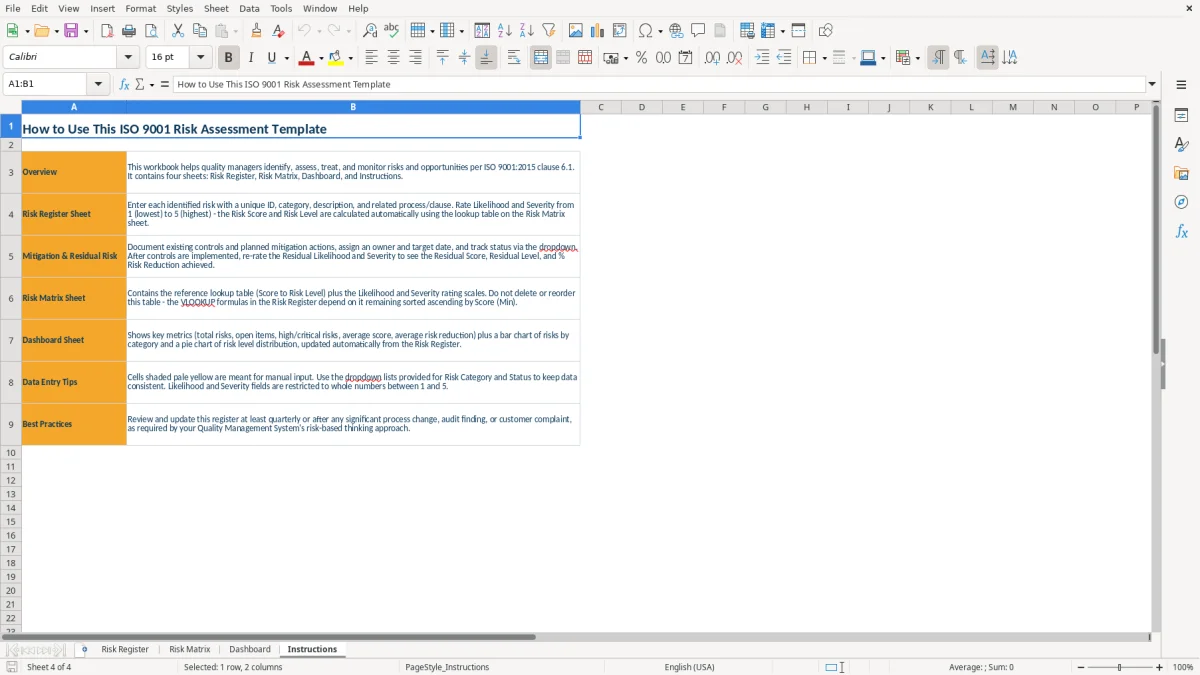
The Risk Matrix (image 2), Dashboard (image 3), and Instructions (image 4) sheets help you interpret the register, review priorities, and apply the scoring method consistently across your quality management system.
The main benefits of this Excel template
- Records each risk against a specific process or ISO 9001:2015 clause instead of keeping disconnected audit notes.
- Scores likelihood and severity on a 1-5 scale, producing a risk score from 1 to 25.
- Compares initial and residual risk after controls and mitigation actions are applied.
- Assigns every treatment action to a named Risk Owner with a Target Date and Status.
- Shows the percentage reduction achieved by controls, making treatment effectiveness easier to discuss.
- Gives management a visual risk matrix and dashboard for review meetings.
- Keeps the register, scoring guidance, and operating instructions together in one Excel workbook.
Step-by-step guide
- Open the Instructions sheet (image 4) and read the scoring guidance before entering risks. Agree on what likelihood levels 1-5 and severity levels 1-5 mean for your organization.
- Go to Risk Register (image 1) and assign a unique Risk ID such as R-001. Enter the Risk Category, Risk Description, and the Related Process/Clause, such as purchasing or clause 8.4.
- Rate the initial Likelihood and Severity from 1 to 5. Review the resulting Risk Score and Risk Level, then check that the priority matches your team's practical understanding of the risk.
- Describe the Existing Controls and enter a specific Mitigation Action. Name the Risk Owner, set a Target Date in MM/DD/YYYY format, and update Status as the action progresses.
- Enter Residual Likelihood and Residual Severity after the treatment is in place. Review the Residual Score, Residual Level, and Risk Reduction % before closing the action.
- Review Risk Matrix (image 2) to see where risks sit by likelihood and severity. Use Dashboard (image 3) during management review to focus on high-level patterns and overdue treatment work.
- Save a dated copy after each formal review. Keep the current workbook controlled under your document-control process and retain evidence supporting the ratings and completed actions.
What is included
Risk Register with fields for Risk ID, category, description, process or clause, controls, treatment, owner, date, and status.
Separate 1-5 Likelihood and Severity inputs for both initial and residual assessments.
Risk Score and Risk Level fields that turn two ratings into a consistent priority measure.
Risk Reduction % field for comparing exposure before and after mitigation.
Risk Matrix sheet for viewing the relationship between likelihood and severity.
Dashboard sheet with a management-level visual summary of the registered risks.
Instructions sheet that keeps the workbook's scoring approach available to every reviewer.
Who uses an ISO 9001 risk assessment spreadsheet in the United States
An ISO 9001 risk register is usually maintained by the quality manager, process owner, operations manager, or internal auditor responsible for the organization's quality management system. A small machine shop may have one quality lead covering purchasing, production, inspection, and shipping; a 40-person distributor may assign a separate owner to supplier approval, order entry, warehousing, and customer complaints.
The need becomes urgent before an internal audit, during a management review, after a customer complaint, or when a new supplier, machine, product, or process is introduced. A contractor preparing for a certification audit might list 18 risks across six processes, while a small service company may begin with eight risks tied to client requirements, scheduling, document control, and subcontractors.
Start with processes, not abstract threats
Use the Related Process/Clause column to connect a risk to a real activity and, where useful, an ISO 9001:2015 clause. For example, a supplier that delivers incorrect steel creates a purchasing risk tied to externally provided processes; a missing revision on a work instruction points to documented information. That connection tells the process owner where the control belongs.
In practice, a risk description should state the event and its consequence. Late material can stop a two-day production run, create $6,000 in expedited freight, and push three customer orders past their promised dates. That is more useful than writing supplier risk because it gives the owner something measurable to control.
Use the register in normal quality work
Review the relevant rows at the monthly operations meeting and whenever a corrective action or change request is opened. A nonprofit laboratory, for example, can review sample-labeling and equipment-calibration risks before each quarterly quality meeting rather than rebuilding a spreadsheet at audit time.
Choose one owner per action, even when several departments contribute. The Risk Register's Risk Owner, Target Date, and Status columns make responsibility visible; the Dashboard (image 3) then gives management a short view without reading every narrative cell.
What ISO 9001:2015 requires from your risk assessment
ISO 9001:2015 clause 6.1 requires an organization to determine risks and opportunities that need to be addressed, plan actions, integrate those actions into its quality management system, and evaluate whether the actions are effective. The standard does not prescribe a particular 1-5 matrix, risk score, or required number of risks. This workbook's 1-5 method is a practical internal convention, not an official ISO formula.
For each row, keep a logical chain: risk event, affected process or clause, existing control, treatment action, owner, deadline, and post-treatment result. If a supplier defect could cause 4 hours of rework, record the receiving inspection control and a supplier corrective-action plan rather than simply labeling the item high risk.
Connect assessment to documented evidence
Clause 9.1 requires monitoring, measurement, analysis, and evaluation of appropriate QMS processes. Your evidence might include a supplier defect rate, on-time delivery percentage, first-pass yield, complaint count, or overdue corrective actions. A supplier with 6 defects in 200 receipts has a 3% defect rate; that number gives the rating discussion more substance than a color alone.
Clause 9.3 makes management review relevant to QMS performance, changes, opportunities, and improvement. Bring the Dashboard and significant open actions to that review, then record decisions in your separate meeting minutes or management-review record.
Do not confuse risk treatment with corrective action
Clause 10.2 addresses nonconformity and corrective action after a problem occurs, including correction, cause analysis, action, and effectiveness review. A preventive risk treatment may exist before a failure, while a corrective action responds to an actual nonconformity; one incident can lead to updates in both records.
Certification auditors generally look for a consistent, evidence-based process, not a particular spreadsheet design. Keep supporting inspection records, supplier evaluations, complaint data, and review decisions with the controlled QMS records; the workbook is the register, not proof by itself that a control works.
Audit evidence also needs a workload view, and a labour distribution chart can show whether the corrective action was covered by the right people at the right time.
Where the ISO risk register breaks down during an audit
The most expensive failure is a register full of ratings that nobody can explain. A team may mark 20 risks as likelihood 2 and severity 2 because those numbers feel safe, even though one missed calibration could invalidate $25,000 of test results. When the auditor asks why the rating is 4 rather than 3, the absence of criteria and evidence becomes a credibility problem.
Static scores hide changing exposure
Another breakdown occurs when the initial score is updated after a control is added, erasing the original exposure. If likelihood falls from 4 to 2 and severity remains 5, the score moves from 20 to 10; retaining both initial and residual fields shows whether the treatment actually reduced exposure. Entering only the new score makes a 50% improvement impossible to demonstrate.
Do not treat a low residual score as permission to ignore the action. A documented inspection may reduce the probability of shipping a defect, but it does not remove the need to verify inspection records, train the operator, or investigate repeated failures. A $900 rework event repeated 12 times costs $10,800 before customer impact and administrative time.
Unowned actions create repeat findings
Descriptions such as improve supplier communication or monitor training are not executable actions. Specify what happens, who does it, and by when: the purchasing manager reviews the supplier's certificate package by 09/15/2026, or the production supervisor adds a first-piece check to the work instruction by 08/31/2026.
Overdue dates also lose meaning when Status is not maintained. A register showing 14 open actions may look controlled until six have passed their Target Date. Review the Status and Target Date together, and document the reason for any extension instead of silently moving the deadline.
Do not mistake a dashboard for analysis
A dashboard can show that five risks are high, but it cannot prove the controls are effective. Compare the risk row to objective results: if complaints rose from 2 to 7 per month after a treatment was marked complete, the action needs investigation even if the residual score was entered as 4.
That kind of follow-up belongs in a continuous improvement log, where each completed action can be checked against the result it was meant to change.
How to make the risk workbook part of your QMS routine
The workbook works best when you attach it to an existing quality event instead of giving it a once-a-year appointment. Review affected rows in the weekly production meeting, supplier meeting, or corrective-action review, and reserve a short monthly check for owners, dates, and residual ratings.
Use a fixed review sequence
- On the first workday of each month, filter the Risk Register by open Status and Target Date.
- Ask each owner for one evidence point, such as 98% on-time supplier delivery or three customer complaints in the period.
- Update residual ratings only after the control or mitigation action is operating.
- Take the Dashboard (image 3) to management review and record decisions outside the workbook.
A 15-minute review of 12 active risks is more sustainable than a four-hour annual rewrite. If four employees each own three actions, the meeting can cover every item in one pass while keeping accountability clear.
Keep entries consistent
Use a controlled vocabulary for Risk Category and Status, and write dates as MM/DD/YYYY. Keep Risk IDs stable; changing R-006 to R-011 after sorting breaks references in meeting notes and audit evidence. Use the Instructions sheet (image 4) as the shared definition of likelihood, severity, and treatment completion.
Save a dated version after management review, such as Q3-2026 risk-register.xlsx, under your document-control rules. Avoid creating separate copies for every department unless one person owns the master; duplicate files quickly produce conflicting scores and missed actions.
Know when Excel is no longer enough
Move to QMS software when you need workflow approvals, automatic reminders, permissions by department, electronic signatures, change history, or evidence linked to individual risks. A 10-person company with 25 risks can manage this workbook well; a multisite manufacturer with 600 risks and 40 owners will usually spend more time reconciling files than assessing risk.
Frequently asked questions about this template
It includes four sheets: Risk Register, Risk Matrix, Dashboard, and Instructions. The register has fields for initial and residual likelihood and severity, scores, levels, controls, mitigation actions, owners, target dates, status, and risk reduction percentage.
No. ISO 9001:2015 clause 6.1 requires you to address risks and opportunities, but it does not mandate a particular matrix, scoring scale, or software. This template uses a practical 1-5 likelihood and 1-5 severity approach, producing scores from 1 to 25.
Define the scale in your Instructions sheet and apply it consistently. For example, likelihood 4 may mean a recurring event, while severity 5 may mean a major customer, regulatory, safety, or operational consequence; support the rating with complaint, defect, supplier, or process data.
Initial risk is the exposure before the planned mitigation is effective. Residual risk is the remaining exposure afterward. For example, a score of 20 from likelihood 4 and severity 5 may fall to 10 when likelihood drops to 2, while severity remains 5.
No. The workbook organizes your risk process, but you still need supporting evidence such as inspection results, supplier evaluations, complaint records, training records, corrective actions, and management-review decisions. Keep those records under your controlled-document and retention procedures.
Assign the person who can make or coordinate the required change, not simply the person who discovered the risk. A purchasing manager may own a supplier action, while a production supervisor may own a first-piece inspection change; enter one accountable owner and a specific Target Date.
Meet the makers