
Project & Planning


Project ROI Excel - Free Template
Evaluate project costs, benefits, ROI, payback, departments, and status in one Excel template for business investment decisions.
2026-07-25
296 downloads
4.8/5
Download template
A project ROI Excel template is a spreadsheet for comparing investment costs with expected benefits across multiple projects. This file contains a Project ROI Analysis sheet with project inputs and calculated results, a Dashboard for portfolio review, and an Instructions sheet.
Enter each project’s cost, annual benefit, duration, department, start date, and status. The analysis calculates total benefit, net profit, ROI percentage, and payback period so you can compare a $30,000 training program with a $150,000 automation project using the same measures.
The main benefits of this Excel template
- Compare investment cost, total benefit, net profit, and ROI for every project in one table.
- See how quickly each project recovers its initial investment through the calculated payback period.
- Sort and review projects by department, department code, project ID, or status during budget meetings.
- Evaluate projects with different durations, such as a two-year training program and a five-year automation investment.
- Use the Dashboard to review the project portfolio without rebuilding summary calculations manually.
- Keep project start dates and ownership details beside the financial assumptions for better decision documentation.
- Give executives, department managers, and finance staff a consistent format for investment proposals.
Step-by-step guide
- Open the Project ROI Analysis sheet and review the sample rows before replacing them with your own projects.
- Enter a unique Project ID, project name, department, department code, and start date in the input columns.
- Enter the expected Investment Cost, Annual Benefit, and Duration (Years) for each project. Use realistic benefits rather than optimistic sales estimates that have not been approved.
- Review Total Benefit, Net Profit, ROI %, and Payback (Years). For example, a $45,000 investment producing $22,000 per year for three years generates $66,000 in total benefit and $21,000 in net profit.
- Update the Status column as a project moves from proposal to approval, implementation, or completion.
- Open the Dashboard to compare the portfolio, then use the Instructions sheet when you need clarification about the layout or calculations.
What is included
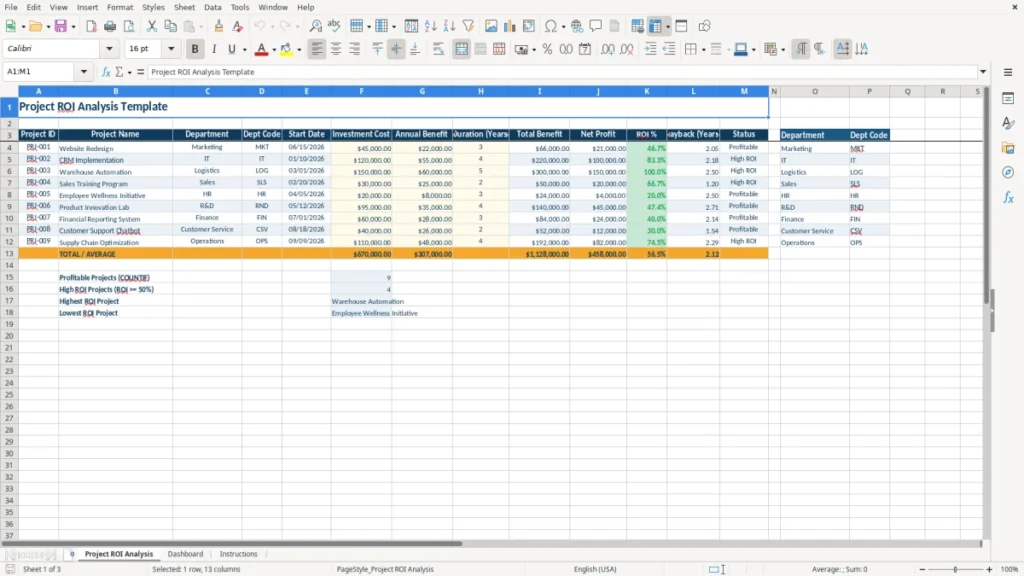
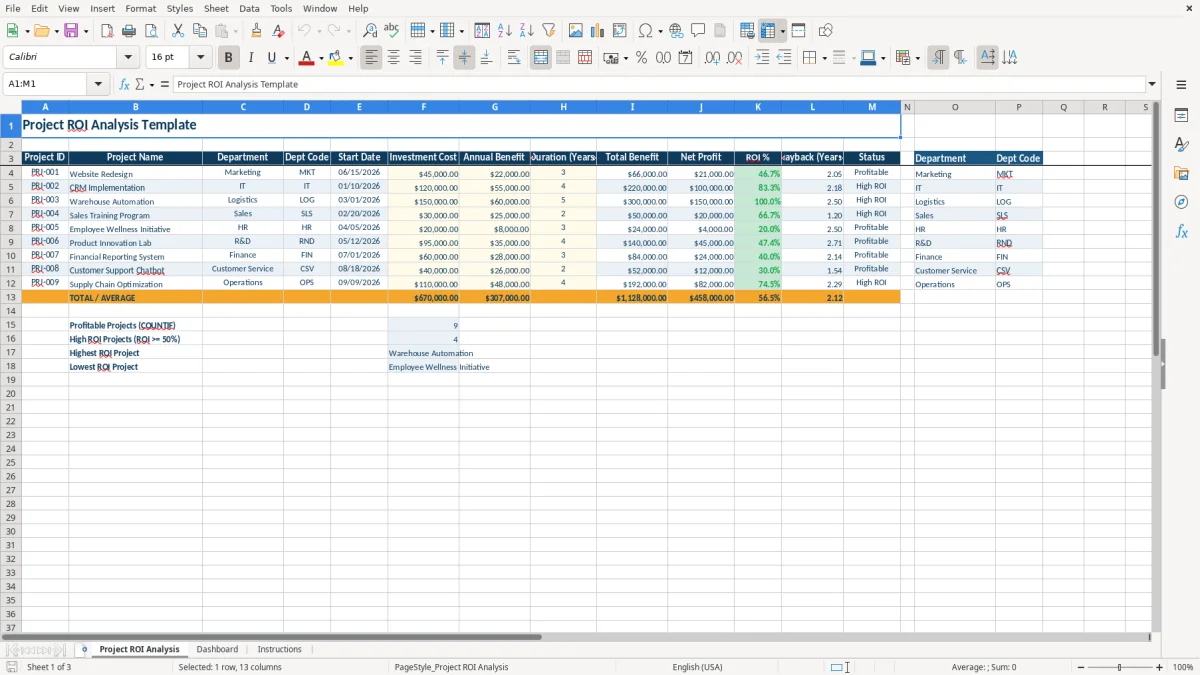
Project ROI Analysis sheet with columns for Project ID, Project Name, Department, Dept Code, Start Date, Investment Cost, Annual Benefit, Duration (Years), Total Benefit, Net Profit, ROI %, Payback (Years), and Status.
Currency formatting for Investment Cost, Annual Benefit, Total Benefit, and Net Profit, with percentage formatting for ROI %.
A structured navy header row and alternating business-oriented fill colors that separate labels from data-entry areas.
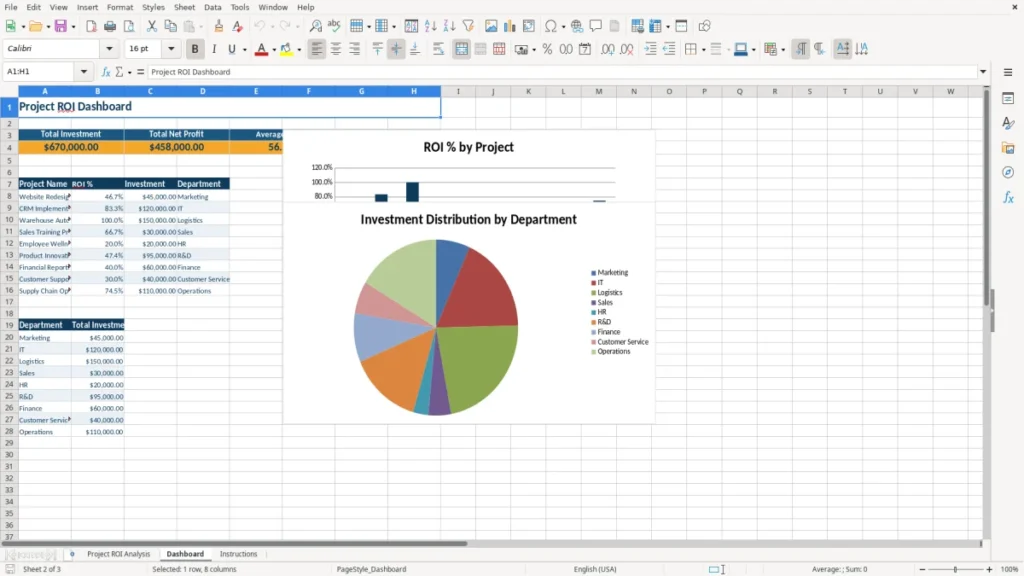
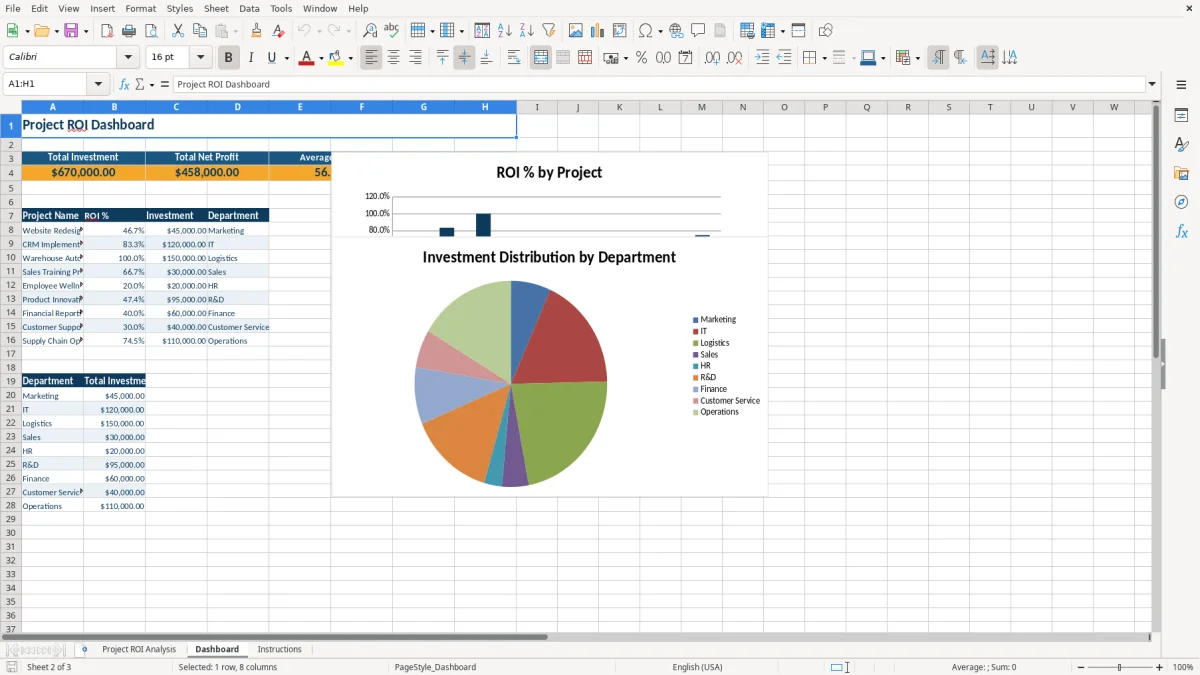
Dashboard sheet for reviewing project performance and portfolio-level results.
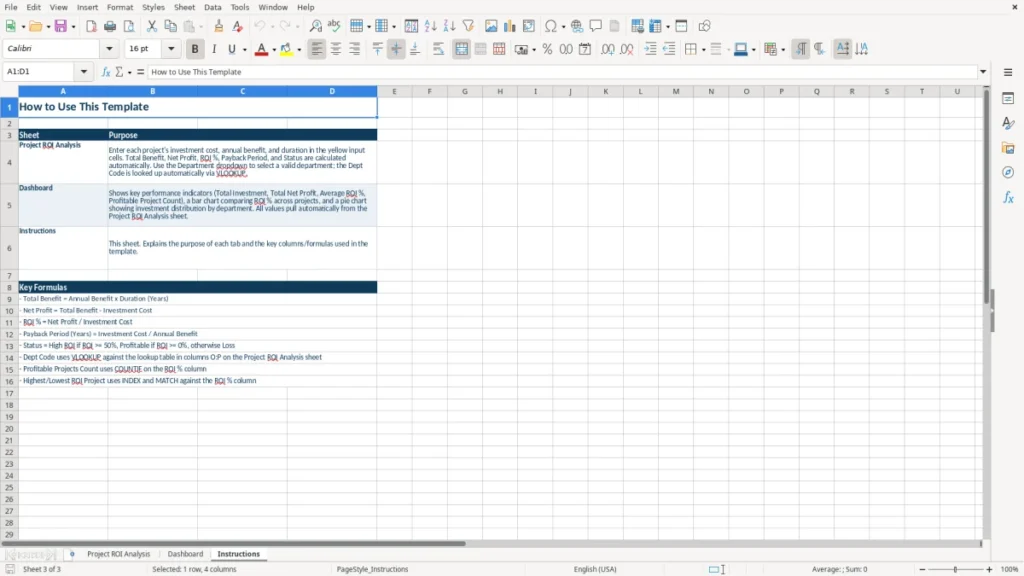
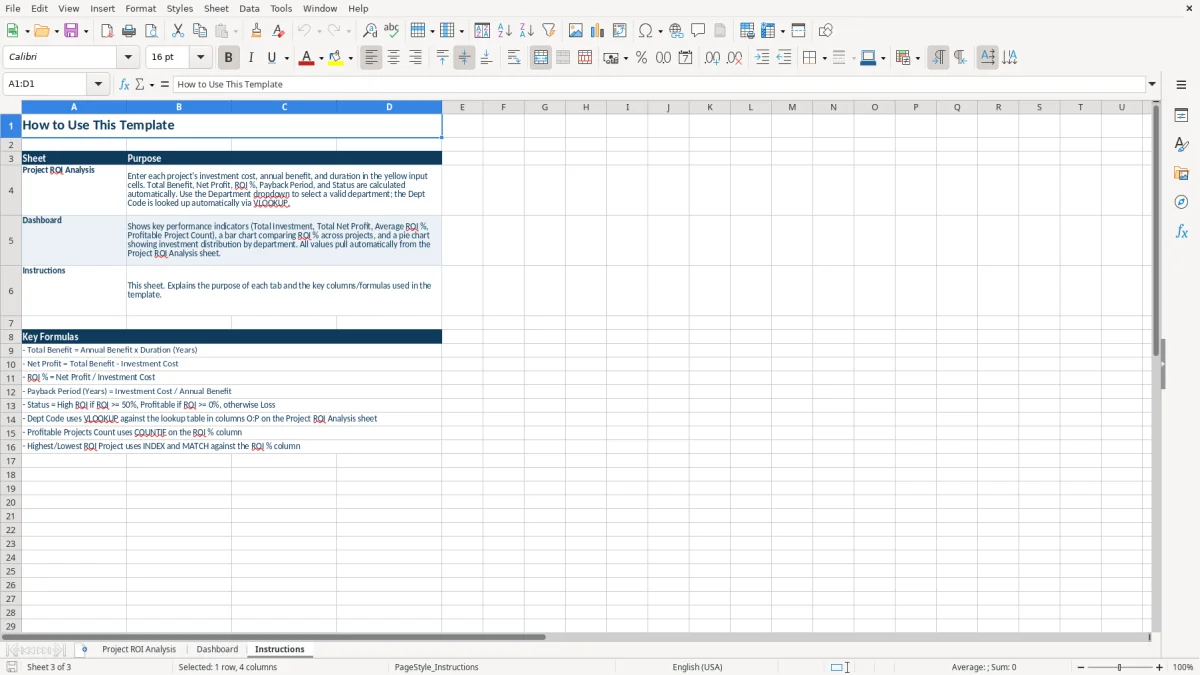
Instructions sheet that explains the intended workflow and how to complete the analysis.
Date formatting using MM/DD/YYYY and numerical formatting using two decimal places for consistent US business reporting.
A reusable layout for capital requests, technology implementations, process improvements, training programs, and other business investments.
Who uses a project ROI spreadsheet in the US
A project ROI spreadsheet is useful when a department has more proposed work than it can fund. A finance manager at an LLC may use it during annual budgeting, while an operations director may update it each month as implementation costs and expected savings become clearer. The comparison is especially useful when projects compete for the same $250,000 capital budget.
From proposal to portfolio review
A contractor with four employees might compare a $45,000 website redesign, a $120,000 CRM implementation, and a $150,000 warehouse automation project. The Project ROI Analysis sheet (image 1) puts those decisions into one row per project, with fields for department, start date, cost, annual benefit, duration, calculated results, and status.
That structure suits a quarterly leadership meeting because the decision-maker can see both the financial case and the operating owner. A project ID such as PRJ-002 is more reliable than searching for a changing project name in email or a budget workbook.
Useful for more than capital equipment
Not every investment is machinery. A sales manager can evaluate a $30,000 training program expected to produce $25,000 per year for two years. An HR manager can record a $20,000 wellness initiative with an $8,000 annual benefit, while an IT manager measures licensing, implementation, and labor savings for a system change.
The strongest use is a common first-pass screen, not a substitute for a full business case. If a project has a $45,000 cost and $22,000 in annual benefit over three years, the model shows $66,000 of total benefit, $21,000 of net profit, 46.7% ROI, and roughly 2.05 years of payback. That gives you a clear starting point for questions about risk, timing, and the quality of the benefit estimate.
How ROI and payback work in a 2026 business case
The template uses straightforward investment math. Total Benefit is annual benefit multiplied by duration; Net Profit is total benefit less investment cost; ROI is net profit divided by investment cost; and Payback is investment cost divided by annual benefit. In formula form, a $120,000 project producing $55,000 per year for four years has $220,000 of total benefit, $100,000 of net profit, 83.3% ROI, and 2.18 years of payback.
What the numbers do and do not prove
ROI is a screening measure, not a federal tax calculation and not a discounted-cash-flow valuation. It does not automatically account for the time value of money, financing costs, taxes, depreciation, residual value, or benefits that arrive unevenly across the project life. For projects lasting more than three years, use this sheet for comparison and add a separate NPV or IRR analysis before final approval.
Do not mix accounting profit with cash savings. A $60,000 equipment purchase may be depreciated over several years under MACRS, while the cash leaves the bank account in month one. Keep the cost and benefit assumptions consistent: compare pre-tax costs with pre-tax benefits, or after-tax costs with after-tax benefits, rather than combining the two.
Budget controls and documentation
Use the Start Date and Status fields to connect the financial case to the approval record. A project marked approved should have a documented cost estimate and benefit owner; a completed project should be compared with actual results in the next review. The IRS does not prescribe one universal business ROI formula, but businesses should retain support for material costs, useful-life assumptions, and benefit estimates as part of their normal recordkeeping.
My practical preference is to rank proposals by both ROI and payback. A 150% ROI that arrives in year five may be less useful than a 60% ROI recovered in 18 months when cash is tight.
Once ROI and payback are set, a project status report is the next place to track which proposals are approved, underway, or ready for the next review.
Where project ROI analysis breaks down in real decisions
The most expensive mistake is overstating annual benefit. A manager may enter $60,000 for a process improvement because the process uses 1,200 labor hours today, but the business may not actually eliminate those hours. If only 400 hours disappear at a $25 loaded cost, the realistic benefit is $10,000, not $60,000. The displayed ROI can fall from 100% to negative 33.3% on a $30,000 investment.
Costs disappear from the first estimate
Implementation labor, data migration, training, consulting, maintenance, and downtime are often left out of Investment Cost. A $50,000 software quote can become $78,000 after $12,000 of implementation work, $8,000 of training, and $8,000 of first-year support. If the annual benefit remains $30,000 for three years, the correct net profit is $12,000 and ROI is 15.4%; the quote-only version would show 80.0%.
Another recurring problem is counting revenue as profit. An online retailer may forecast $100,000 of new sales from a project and call that the annual benefit, even though a 60% cost of goods sold leaves only $40,000 before fulfillment, advertising, and payroll. Enter the contribution benefit, not the top-line sales number.
False precision creates bad rankings
ROI shown to one decimal place can look authoritative even when the assumptions are guesses. A project with a 46.7% ROI is not truly more attractive than one at 44.9% if both benefit estimates have a 20% forecasting range. Use the Status field to distinguish proposed assumptions from approved or completed work, and review the assumption owner instead of treating the percentage as a promise.
Payback can also mislead when benefits are seasonal. A project that saves $24,000 annually may produce $12,000 in each of two busy months rather than $2,000 every month. The template's annualized payback is useful for a first comparison, but a monthly cash-flow schedule is the better tool for a project where timing affects borrowing or payroll.
A monthly cash-flow schedule is the better tool for a project where timing affects borrowing or payroll, and a labour planning chart shows whether those savings line up with the crews available to deliver them.
How to make project ROI review part of your planning cycle
Make the workbook part of an existing meeting rather than creating a separate administrative task. A small business can update assumptions on the first Friday of each month, before the cash-flow review; a larger company can refresh the file before the monthly capital committee. Ten projects taking six minutes each to verify costs and benefits is a manageable one-hour review.
Use a controlled update routine
Start with one row per project and one person responsible for each Annual Benefit estimate. Keep vendor quotes, staffing calculations, and savings schedules in the project folder, then record the approved amount in the workbook. Do not overwrite the original proposal without keeping a dated copy; that makes it possible to explain why a $120,000 estimate later became $135,000.
- Update Investment Cost after purchase orders, approved change orders, or implementation estimates change.
- Reconfirm Annual Benefit with the department owner instead of carrying forward an untested forecast.
- Change Status only when the approval or completion decision is documented.
- Review unusually high ROI or very short payback first; those figures often identify an omitted cost.
Know when Excel is no longer enough
This template works well for a modest portfolio that one finance or operations person can maintain. If 100 managers edit the file, projects require monthly actual-versus-budget tracking, or benefits depend on hundreds of transactions, move to a budgeting or project-management system with permissions, version history, and an audit trail.
For a smaller portfolio, keep the workbook deliberately simple. The Dashboard (image 2) gives you a review point, while the Instructions sheet (image 3) provides a reference for users who do not work in finance every day. Store the master file in a controlled folder and make a new dated copy after each approval meeting.
Frequently asked questions about this template
It calculates Total Benefit, Net Profit, ROI %, and Payback (Years) from the Investment Cost, Annual Benefit, and Duration (Years) entered for each project. For example, a $45,000 cost and $22,000 annual benefit over three years produce $66,000 of total benefit, $21,000 of net profit, 46.7% ROI, and about 2.05 years of payback.
The workbook contains three sheets: Project ROI Analysis, Dashboard, and Instructions. Project ROI Analysis is the detailed input and calculation table, Dashboard is the portfolio review sheet, and Instructions explains how to work with the file.
Use the recurring annual profit improvement or cost reduction the project is expected to deliver, not gross revenue alone. For instance, $100,000 of additional sales at a 40% contribution margin represents $40,000 before other project-related expenses, not a $100,000 annual benefit.
No. This template uses simple ROI and payback calculations based on total benefit, investment cost, annual benefit, and duration. For a long project or one with uneven cash flows, prepare a separate NPV or IRR analysis using monthly or annual cash-flow timing.
Yes. The spreadsheet is entity-neutral and can support project comparisons for an LLC, corporation, nonprofit, or department. Keep tax treatment, depreciation, financing, and capitalization decisions in your accounting records rather than assuming the ROI result handles them automatically.
Review active projects at least monthly and refresh the workbook before a budget or capital-approval meeting. Update the cost after a purchase-order change and have the department owner reconfirm the annual benefit; a forecast should not remain unchanged for 12 months just because the project name is the same.
Meet the makers