
Project & Planning


Project Plan Excel - Free Template
Project plan workbook for tracking tasks, milestones, owners, deadlines, completion, budgets, costs, status, and project health in Excel.
2026-09-14
392 downloads
4.8/5
Download template
This project plan with milestones Excel template organizes tasks, owners, phases, milestone dates, completion percentages, hours, budgets, actual costs, and notes in one workbook. It includes a Project Plan input sheet with 100 prepared rows, a Dashboard with KPIs and charts, and an Instructions sheet.
Enter your project information in the pale yellow input cells and let the calculated fields show cost variance, days remaining, and whether each task is Complete, On Track, Monitor, or At Risk. The workbook includes sample project data so you can see how the layout works before replacing it with your own.

The main benefits of this Excel template
- Track up to 100 task rows with unique Task IDs, owners, departments, cities, phases, and milestones.
- See whether a task is On Track, Monitor, or At Risk using its due date and completion percentage.
- Compare planned Budget with Actual Cost and identify overspending through the calculated Variance column.
- Monitor project-wide totals, completion, at-risk tasks, and hours from the Dashboard.
- Review status counts for Not Started, In Progress, Complete, and On Hold work.
- Compare task counts, average completion, budgets, and actual costs across six project phases.
- Follow milestone due dates and owners in the Dashboard timeline chart.
Step-by-step guide
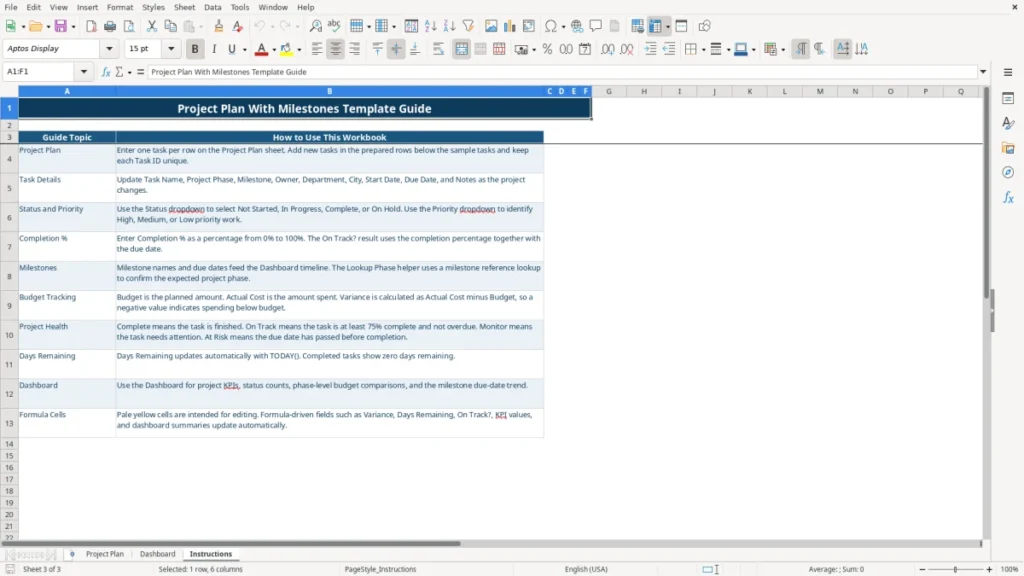
- Open the Instructions sheet and review the guidance for inputs, statuses, milestones, budget tracking, and formula-driven fields.
- Go to Project Plan and replace the sample rows with your own work. Enter one task per row and keep every Task ID unique.
- Complete the task details, including Task Name, Project Phase, Milestone, Owner, Department, City, Start Date, Due Date, and Notes.
- Choose Status from the dropdown and select High, Medium, or Low for Priority. Enter Completion % as a value from 0% to 100%.
- Enter Planned Hours, Actual Hours, Budget, and Actual Cost for each task. Leave the calculated Variance, Days Remaining, On Track?, and Lookup Phase fields intact.
- Review the Dashboard for totals, status counts, phase comparisons, milestone dates, and the three included charts.
- Update due dates, status, completion, hours, and costs during each project review so the formulas and Dashboard reflect current information.

What is included
Project Plan sheet with columns for Task ID, Task Name, Project Phase, Milestone, Owner, Department, City, dates, status, priority, completion, hours, costs, variance, health, and notes.
Prepared operational rows from 2 through 101, with sample tasks in the first rows and additional rows available for project entry.
Dropdown validation for Status and Priority, plus decimal validation that limits Completion % to 0 through 1.
Automatic Variance calculation as Actual Cost minus Budget, making negative values indicate spending below budget.
Automatic Days Remaining calculation based on the due date and TODAY(); completed tasks display zero.
On Track? logic that identifies Complete, At Risk, On Track, or Monitor based on status, due date, and the 75% completion threshold.
Dashboard with KPI summaries, status and phase analysis, milestone details, and three charts.
Who uses a project plan Excel template with milestones
A project manager uses this workbook when a project has more moving parts than a simple to-do list but does not justify specialized project software. An office manager at a contractor, a bookkeeper coordinating an LLC’s implementation, or a nonprofit treasurer preparing a facility upgrade can assign each task to an owner and tie it to a specific milestone.
For example, a contractor with four employees might enter site survey, permit submission, material ordering, installation, and inspection as separate tasks. A $48,000 job could have a $12,000 materials budget, 160 planned hours, and a milestone called Final Inspection. The Project Plan sheet lets the manager see the responsible person, due date, phase, priority, and cost position on the same row.
When the spreadsheet earns its place
Use it at kickoff to turn a scope document into accountable work. During a weekly Monday meeting, filter the rows by owner or phase, update Completion %, and focus on deadlines inside the next 14 days rather than reading every project email.
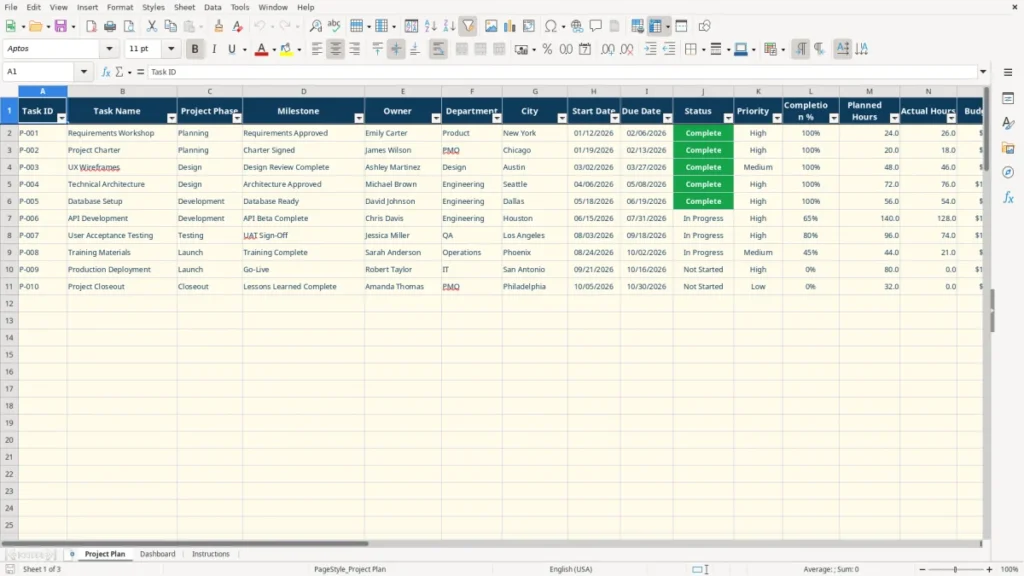
The sample rows show how a task can connect an activity to a milestone: Requirements Workshop leads to Requirements Approved, while Project Charter leads to Charter Signed. Image 1 shows the Project Plan sheet with columns from Task ID through Notes, followed by lookup helper columns.
Small teams benefit most
An online store launching a new checkout process may have 30 tasks across Planning, Design, Development, Testing, Launch, and Closeout. With six people contributing part-time, the owner and phase columns make handoffs visible without requiring each employee to learn a separate system.
This is a planning and monitoring workbook, not a resource-loaded scheduling engine. It records one task per row and calculates useful health indicators, but it does not create dependencies or automatically reschedule downstream work.

How the workbook calculates milestone and project health
The workbook uses ordinary Excel formulas rather than an external project-management service. On Project Plan, Variance is calculated as Actual Cost minus Budget. If Budget is $4,800 and Actual Cost is $5,100, the result is $300, meaning the task is $300 over budget; a result of -$300 means spending is below budget.
Days Remaining subtracts TODAY() from Due Date for open tasks. A completed task displays zero. On 09/08/2026, an open task due 09/15/2026 shows 7 days remaining, while an open task due 09/01/2026 is overdue and shows -7.
The 75% status threshold
The On Track? formula first checks whether the row is complete. Otherwise, an overdue task is At Risk. A task that is not overdue and has Completion % of at least 75% is On Track; other active work is Monitor. This is a clear management rule, not a forecast of the final delivery date.
Use the Completion % validation correctly: enter 75% or 0.75, not 75. Entering 75 would exceed the permitted 0-to-1 range. The Status dropdown permits Not Started, In Progress, Complete, and On Hold, while Priority permits High, Medium, and Low.
What appears on the Dashboard
Dashboard KPIs use COUNTA, COUNTIF, AVERAGE, and SUM to show total tasks, completed tasks, overall completion, total budget, actual cost, budget variance, at-risk tasks, and average planned hours. The phase section uses SUMIF to compare six named phases.
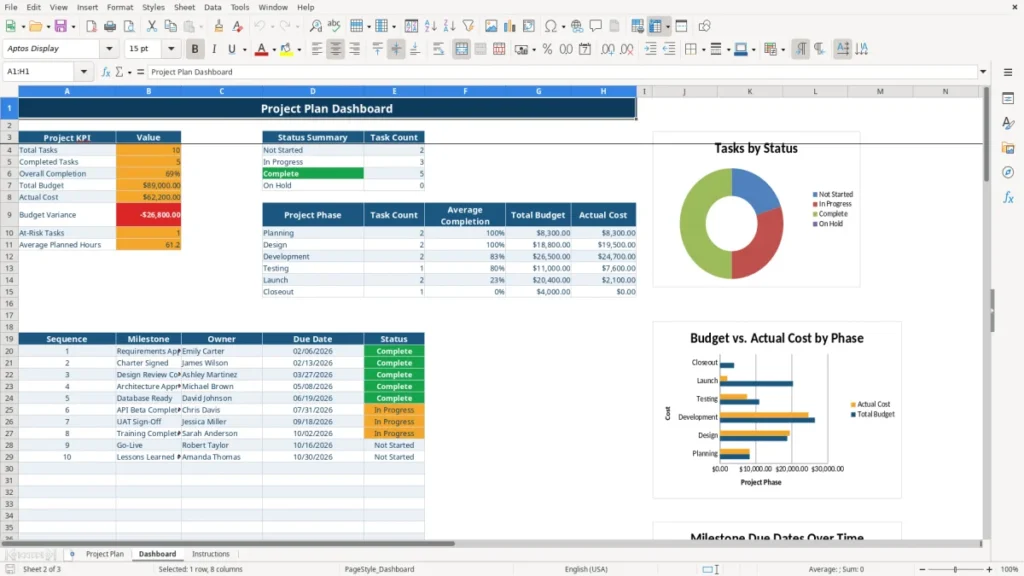
Image 2 shows the Dashboard layout with KPI values, status summary, phase-level budget comparisons, milestone rows, and three charts. The milestone chart is fed by the Dashboard milestone list; it does not replace a formal critical-path schedule.
Where milestone tracking breaks down in small projects
The first expensive mistake is treating a milestone as a vague intention. Writing Design in the Milestone column does not tell anyone what proves completion. Requirements Approved or Charter Signed is better because the team can point to a specific decision, document, or signoff.
A second problem is entering dates and status only at the end of the month. Suppose a $25,000 website project has 40 tasks and its testing milestone is due Friday. If Completion % remains at 40% until the Friday meeting, the On Track? result cannot warn you early. The formula can calculate risk only from the information you maintain.
Costs become unreliable through inconsistent entry
Do not mix labor dollars, vendor invoices, and committed purchase orders in Actual Cost without a policy. A project may show a $2,000 budget and $1,200 actual cost simply because a $900 vendor bill has not been entered. That apparent -$800 variance is not savings; it is incomplete reporting.
Hours create the same trap. If one employee enters 8 hours per workday and another enters 0.5 for a half-day, the figures are comparable. If a third person enters 4 to mean four hours in one row and four days in another, planned-versus-actual analysis loses meaning.
Bad labels create bad summaries
The Dashboard groups work by exact phase names such as Planning, Design, Development, Testing, Launch, and Closeout. Typing Developement or Launching creates a label that will not roll into the intended phase summary. The Lookup Phase field can also show Not Found when a milestone does not match the reference list.
Finally, changing formula cells to typed values can freeze yesterday’s answer. A task completed today should move from an overdue calculation to zero Days Remaining only when Status is changed to Complete. Overwriting the formula with a number hides that change and can distort the Dashboard.
How to make the project plan part of your weekly routine
Assign one short review to an existing meeting instead of expecting people to maintain the file whenever they remember. A Friday project review works well: owners update status, Completion %, Actual Hours, Actual Cost, and Notes before the project manager reads the Dashboard.
For a 25-task implementation, reserve 15 minutes for data entry and 15 minutes for decisions. Sort or filter the Project Plan by Due Date and Priority, then discuss only rows that are overdue, due within seven days, or marked Monitor. The workbook’s filter covers columns A:T, so the calculated fields remain visible during that review.
Keep inputs clean
- Use the existing Status and Priority dropdowns rather than typing alternate labels.
- Enter dates consistently as MM/DD/YYYY and completion as a percentage between 0% and 100%.
- Use one naming convention for phases and milestones so Dashboard summaries and Lookup Phase results remain useful.
- Leave formula-driven columns such as Variance, Days Remaining, and On Track? unchanged.
At month-end, reconcile Actual Cost to invoices or the project ledger. If the Dashboard says Actual Cost is $18,400 but the ledger shows $19,100, correct the task rows before reporting the project’s $700 difference to management.
Know when Excel is no longer enough
This workbook is a practical choice for one project with up to 100 prepared task rows and a small team. Move to dedicated software when you need automatic task dependencies, shared simultaneous editing with permissions, time tracking integrations, baselines, or several hundred active tasks across multiple projects.
Keep a dated copy at each major milestone if you need a simple audit trail. That gives you a before-and-after record without changing the workbook’s formulas or adding unsupported automation.
Frequently asked questions about this template
The Project Plan sheet has prepared rows 2 through 101, providing 100 task rows including the sample entries. Keep each Task ID unique and use the rows below the samples for your own work.
Variance equals Actual Cost minus Budget. If the budget is $10,000 and actual cost is $10,750, the formula shows $750 over budget. A negative result indicates spending below the planned amount.
Complete status returns Complete. An open task past its due date returns At Risk. A task that is not overdue and is at least 75% complete returns On Track; other active tasks return Monitor.
Enter a percentage from 0% to 100%, such as 50% or 0.5. The validation allows values from 0 through 1, so entering 50 instead of 50% is invalid.
The Dashboard includes project KPIs, status counts, phase-level task and budget summaries, a milestone list with sequence, milestone, owner, due date, and status, plus three charts. Its values update from the Project Plan entries.
Lookup Phase uses a VLOOKUP against the workbook’s reference milestone list. Not Found means the Milestone text does not exactly match a reference entry, so check spelling and naming before relying on the phase result.
Meet the makers