
Project & Planning


Multiple Project Status Report Excel - Free Template
Track project dates, budget, percent complete, and status in one workbook with tracker, dashboard, and code legend.
2026-07-11
174 downloads
4.8/5
Download template
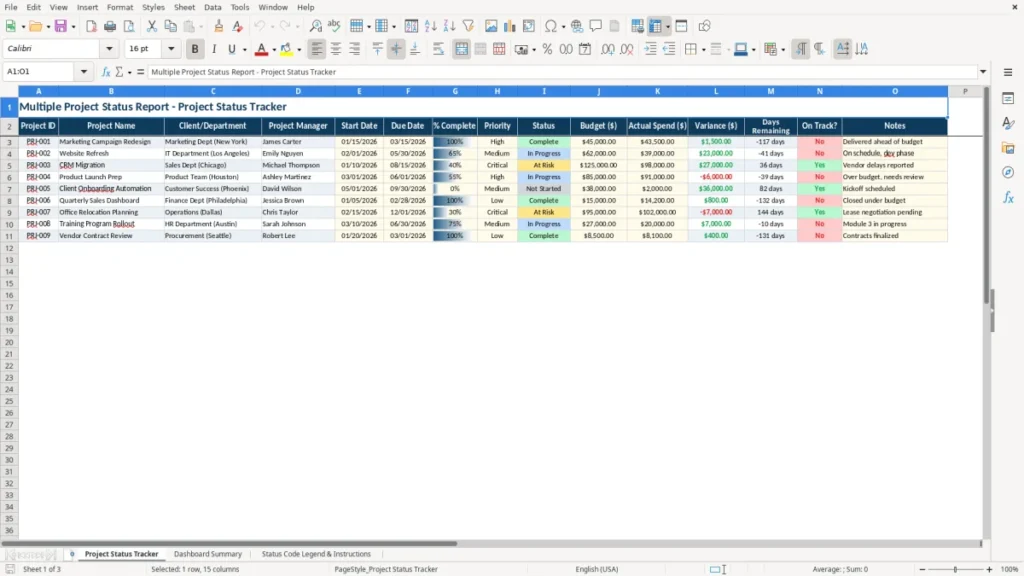
This multiple project status report Excel template tracks each project’s ID, name, owner, dates, percent complete, budget, actual spend, variance, and on-track status in one workbook. It is built to help you review active work, spot late items, and compare project spend against plan without building your own tracker.
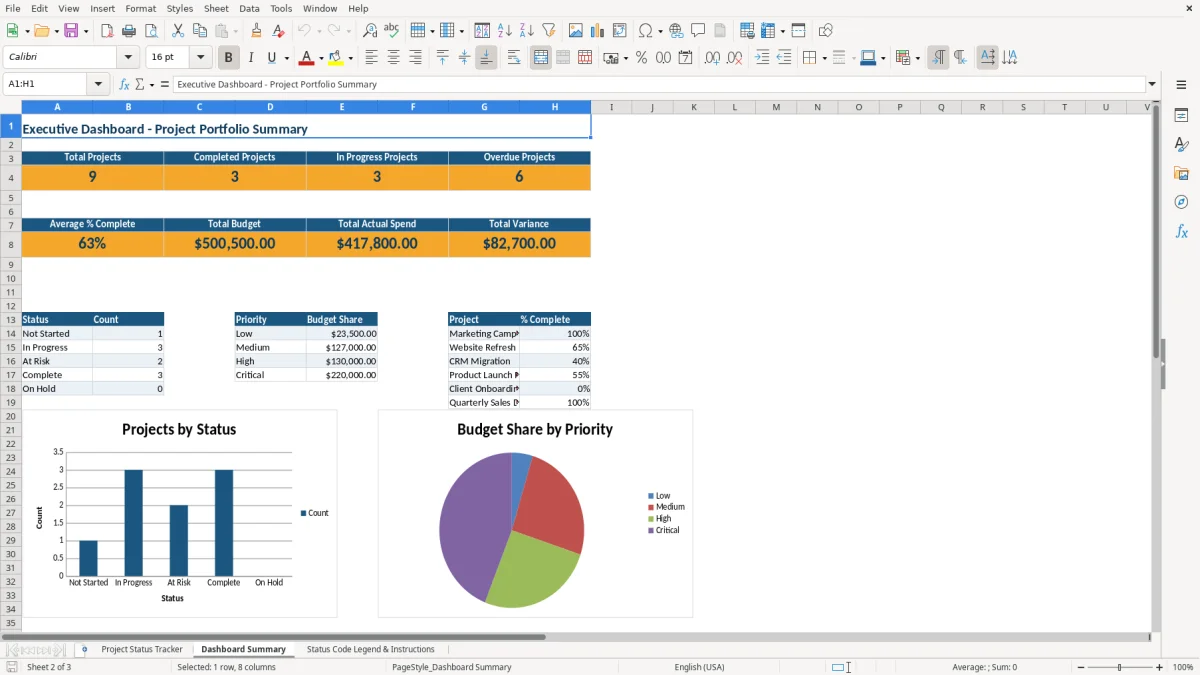
The workbook includes three sheets: Project Status Tracker for input, Dashboard Summary for the visual overview, and Status Code Legend & Instructions for the color and status guide. Use it when you need one clean file for a portfolio, department, client work, or internal jobs.
The main benefits of this Excel template
- Track up to 15 project fields in one row, including % Complete, Budget ($), Actual Spend ($), and Variance ($).
- See which projects are late in days, not just by feeling, with a Days Remaining field and an On Track? check.
- Compare planned vs. actual spending on every project, which makes a $45,000 campaign and a $62,000 website refresh easy to review side by side.
- Give managers and department leads one shared view instead of a stack of separate status emails.
- Use the dashboard to turn raw rows into a quick summary of complete, active, and at-risk work.
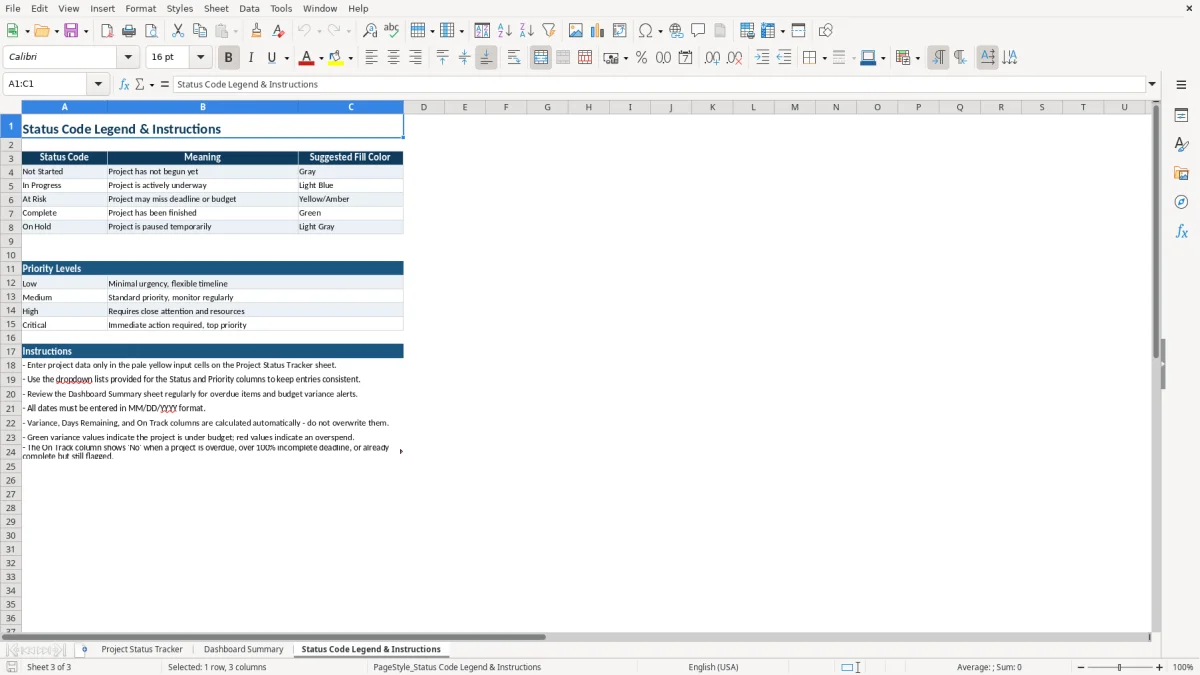
- Keep status codes consistent with a built-in legend so one person’s In Progress means the same thing as another’s.
- Make monthly or weekly updates faster by entering only the changed fields and keeping the rest of the row intact.
Step-by-step guide
- Open Project Status Tracker and enter one project per row. Use the project ID, owner, dates, budget, and current status.
- Update % Complete, Actual Spend ($), and notes each week or each reporting cycle. Keep the date format as MM/DD/YYYY.
- Check Variance ($) to see which projects are under or over budget. A $62,000 budget with $39,000 spent shows $23,000 still available.
- Review Days Remaining and On Track? before your meeting. A project due in 12 days with 40% complete needs attention fast.
- Open Dashboard Summary to review the portfolio at a glance. Use it for a weekly leadership update or a client call.
- Use Status Code Legend & Instructions whenever you need to confirm the meaning of each status and color.
- Copy the workbook tab for a new month or quarter so you keep one clean reporting cycle per file.
What is included
Three-sheet structure: tracker, dashboard, and status legend.
Project-level fields for dates, budget, spend, variance, and notes.
Color-coded headers and alternating row formatting for easier reading.
Dashboard summary sheet for portfolio-level review.
Status legend sheet that explains the codes and instructions in plain language.
Built for weekly status meetings, month-end reporting, and client updates.
Usable for internal projects, marketing work, IT jobs, construction tasks, and nonprofit initiatives.
Who uses a multiple project status report Excel template
This template fits the people who have to answer, every week, “what is late, what is over budget, and what can wait?” That includes a project manager in a 12-person agency, an office manager at a contractor running 4 jobs at once, a nonprofit treasurer tracking grant work, or a department head who needs one clean status file for a leadership meeting.
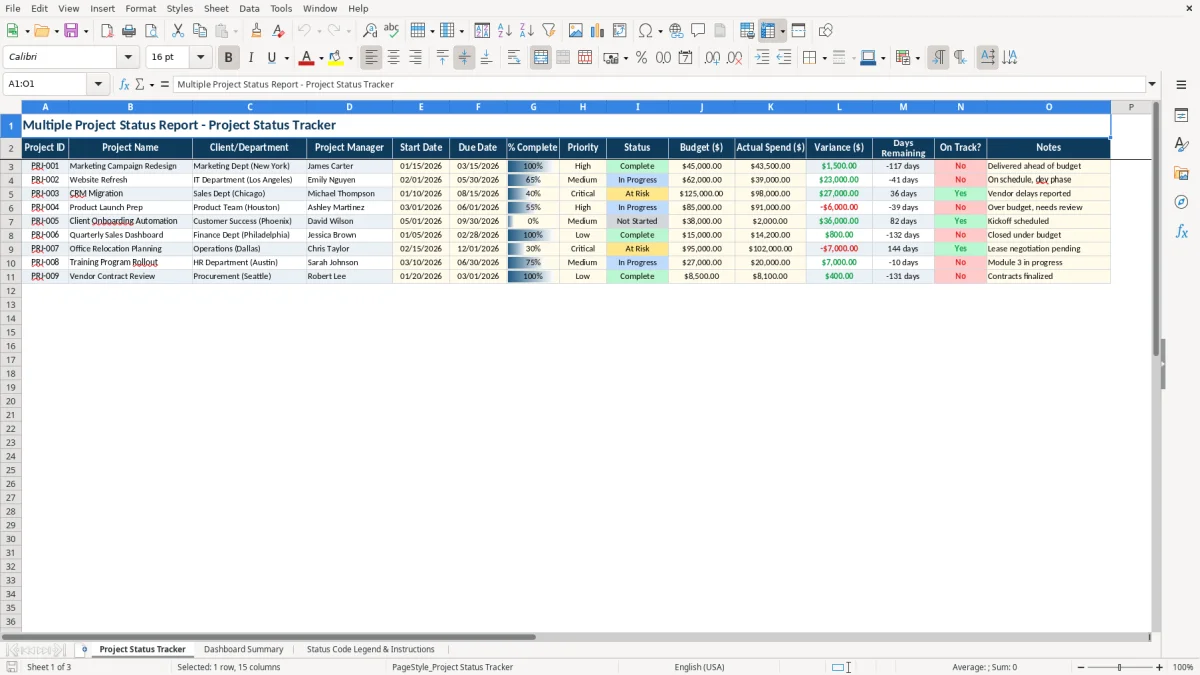
Image 1 shows the Project Status Tracker sheet with 15 columns across the page, so each project stays on one line. The fields cover the basics you actually report: project ID, manager, start date, due date, % Complete, budget, actual spend, variance, days remaining, and a yes/no on whether the job is on track.
How the tracker works in real life
If you manage 8 projects and 3 of them are due in the next 14 days, you do not need a long narrative. You need a row-by-row list that shows which items are at 95%, which ones are stuck at 40%, and which ones have already burned through $12,000 of a $10,000 budget.
Why the dashboard matters
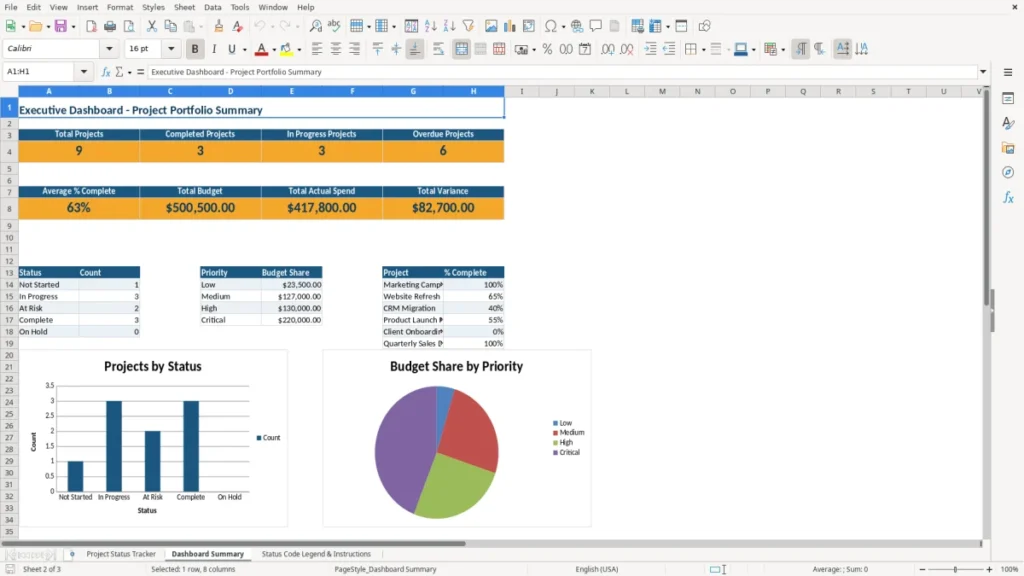
Image 2 gives you the summary view, which is the one you pull up in a meeting. Instead of scanning 40 rows, you can talk about the portfolio in one glance and decide whether to reassign work, push a deadline, or hold spend.
Where the legend helps
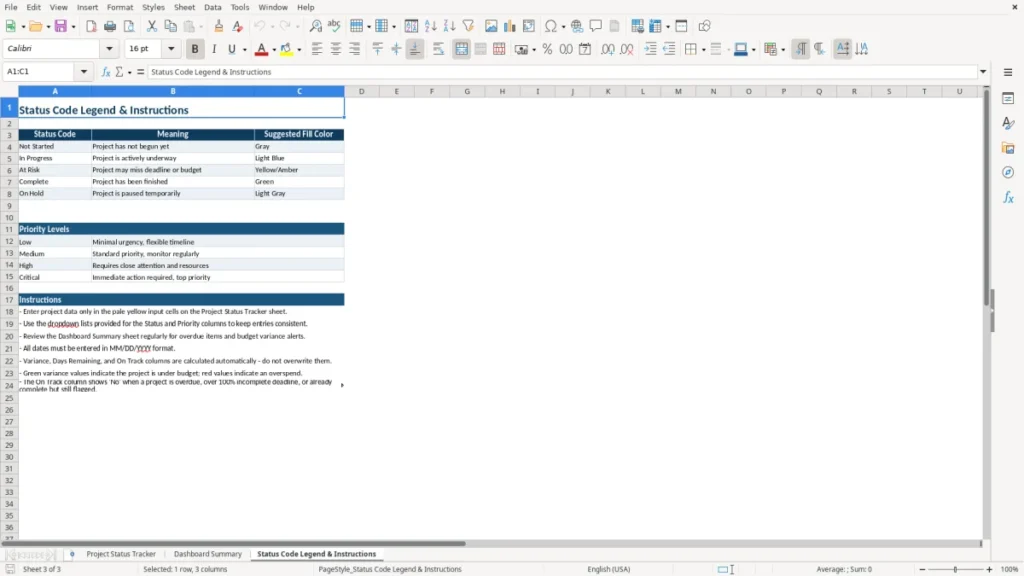
Image 3 is the Status Code Legend & Instructions sheet, which keeps the reporting language consistent. If one person uses “In Progress” and another uses “At Risk,” the legend keeps the file readable and cuts down on back-and-forth during closeout.
What the IRS and recordkeeping rules mean here
This workbook is not a tax form, but it supports the kind of recordkeeping you need when project costs feed the books, a client invoice, or a year-end file. For a sole proprietorship filing Schedule C or an LLC that still tracks jobs manually, the useful habit is to keep the tracker aligned with your receipts, billings, and bank activity.
The IRS generally expects you to keep business records for 3 years, and longer in some cases such as property records or losses. If you logged a $62,000 website project in March and closed it in May, this sheet gives you the dates, status, and spend trail you will want if you later need to justify a deduction or a profit figure.
Why status tracking helps the books
A project tracker is useful because it ties operational work to financial timing. If a contractor has 4 employees and a $180,000 job runs two months late, the labor and subcontractor bills can land in a different period than the client invoice, which affects cash flow and the profit and loss.
Cash basis or accrual basis
For a small service business, cash basis is usually simpler until you have enough open jobs that timing starts to distort the numbers. Once you are juggling multiple projects across months, accrual-style tracking is the better choice because it matches the work performed to the spend and revenue more closely.
Useful forms and thresholds
If project work is tied to outside contractors, the paperwork often runs through W-9 and 1099 records, plus an EIN or SSN on the invoice file. A clean project report does not replace those forms, but it gives you the job name, dates, and spend totals that make the tax file easier to reconcile.
Where project tracking goes wrong and what it costs
The most common failure is not the spreadsheet itself. It is stale data: a project says 80% complete when the team already spent the last 3 days on a change order, or the due date was moved but nobody updated the file.
Bad percent complete numbers
If one manager marks a $45,000 campaign as 90% complete while another uses 90% to mean “almost done but waiting on approval,” your dashboard becomes noise. That kind of mismatch can make you underreact to a job that is already 2 weeks behind and overreact to one that is actually fine.
Budget variance that is not checked
A $20,000 overrun on a $50,000 project is not a rounding error. If you miss it for a month, the next billing cycle can bury the issue and force you to explain a margin problem after the money is already gone.
Dates that drift by a few days
When 10 projects each slip by 5 days, the business loses 50 scheduled workdays in the month. That can create overtime, rush fees, or delayed client billing, which is why the Days Remaining field matters more than a vague “green/yellow/red” note.
Notes that do not say what changed
A note like “waiting” is almost useless. A note like “awaiting client approval on revised scope, sent 04/14/2026, no spend approved yet” gives you the paper trail you need for the next status meeting and for any dispute about delay or cost.
That same paper trail is easiest to read when the days lost are matched against a work schedule, so the next status meeting shows whether the slip came from approvals, holidays, or a real scope delay.
How to make the status report part of your routine
The template works best when you tie it to an existing habit, not when you treat it like a separate admin chore. Most small teams update it right after the weekly check-in, the payroll run, or the Monday planning meeting.
Simple routine that actually sticks
- Update the tracker every Friday at 3:00 p.m. after the project call.
- Copy the prior week’s file so the structure stays the same and only the changes need attention.
- Use data validation for status and priority so you do not get spelling differences like “In progress,” “in progress,” and “IP.”
Use the dashboard as the meeting screen
Image 2 should be the first tab you open in the review meeting. If the dashboard shows 2 projects due within 7 days and one of them is already at $11,400 on a $10,000 budget, you know exactly what to discuss first.
Know when spreadsheet tracking is not enough
If you are managing 30+ active jobs, multiple approvers, or time entries that need role-based access, a spreadsheet starts to slow you down. At that point, move to project management software or a database-backed system and keep this workbook only for summary reporting.
At that point, keep this workbook for summary reporting and use a construction budget to track the cost side in more detail.
Frequently asked questions about this template
It is used to track several projects in one workbook so you can see due dates, percent complete, budget, actual spend, and current status together. If you are juggling 5 to 20 active jobs, it is much faster than reading separate emails or scattered notes.
The workbook includes Project Status Tracker, Dashboard Summary, and Status Code Legend & Instructions. That gives you one input sheet, one summary view, and one reference sheet for the status codes.
Enter the planned budget in Budget ($) and the amount you have spent in Actual Spend ($). The Variance ($) field shows the gap, so a $62,000 budget with $39,000 spent leaves $23,000 unspent.
Yes. The Client/Department field lets you track a marketing client, an IT department, a contractor job, or an internal initiative in the same layout. That makes it easy to compare different work streams without changing the sheet structure.
Weekly is the best default for most teams, especially if you have active deadlines or spend moving each week. If your projects move fast, update it after each status meeting so the dashboard stays current.
Move on when one file can no longer handle the workload cleanly, such as 30+ projects, multiple approvers, or a need for live collaboration and audit trails. Until then, this template is a solid low-cost way to keep the portfolio organized.
Meet the makers