
Project & Planning


Labour Histogram Excel - Free Template
Track hours, overtime, and pay by employee and department with a labor log, histogram dashboard, summary, and instructions.
2026-07-12
198 downloads
4.8/5
Download template
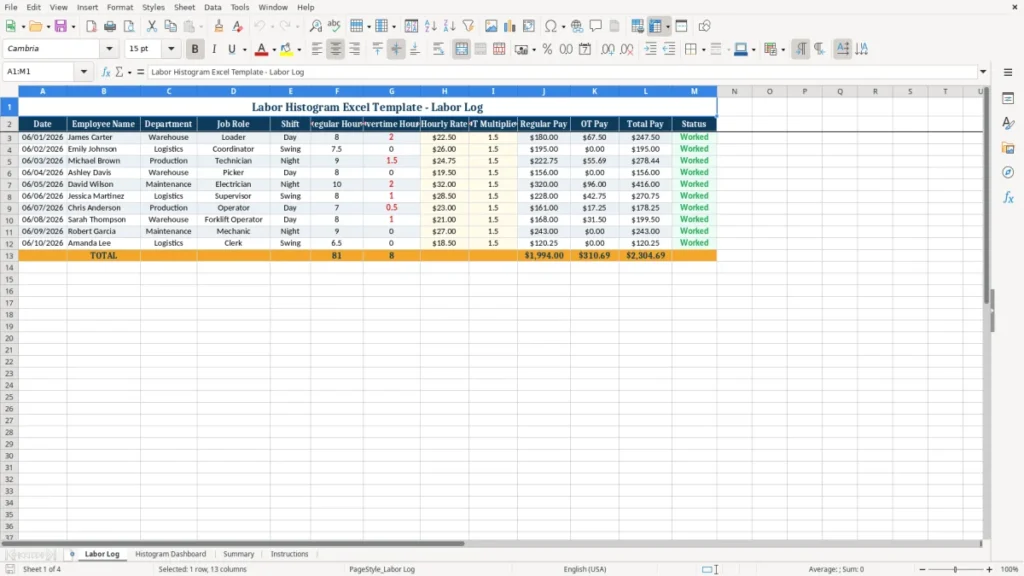
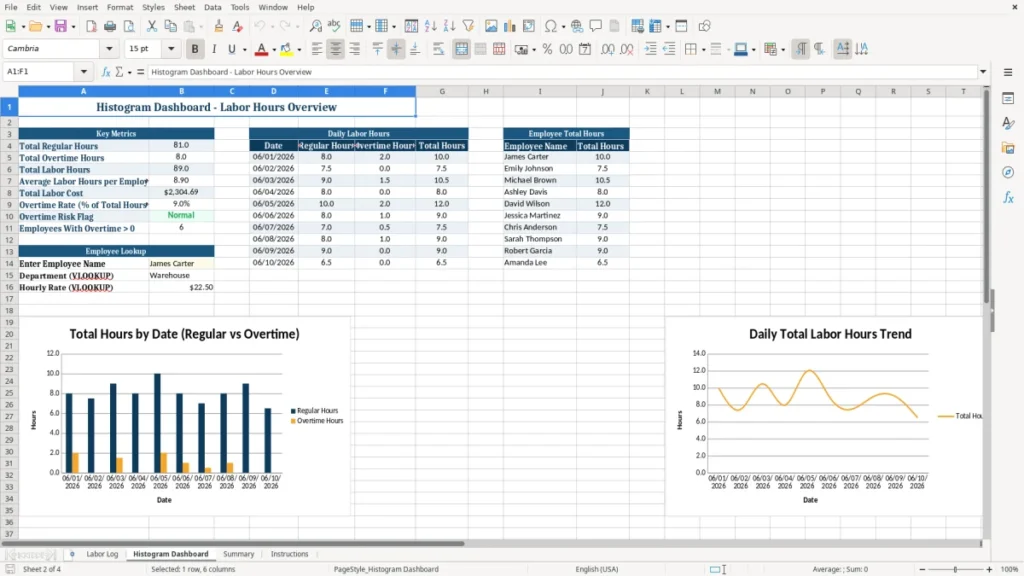
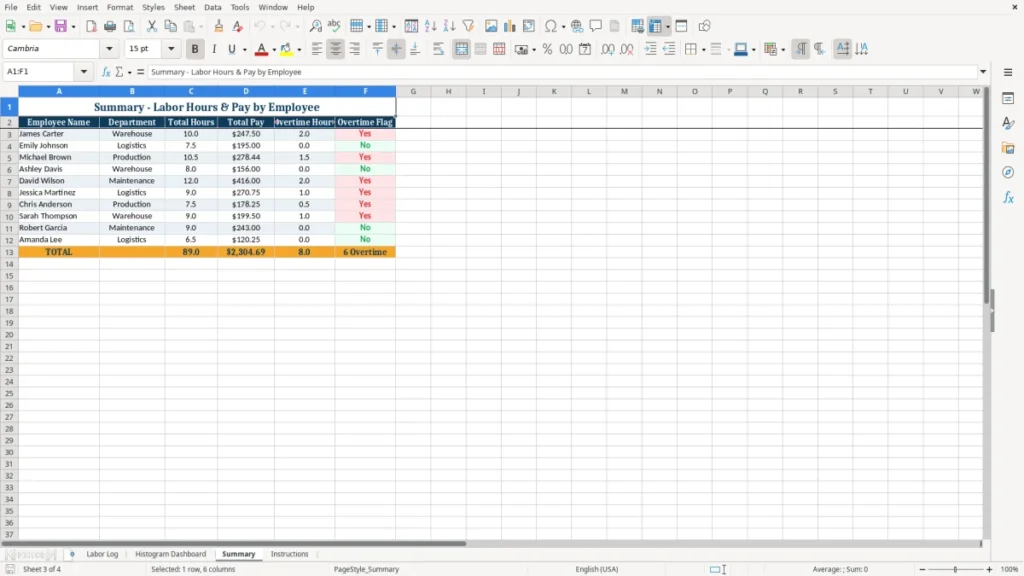
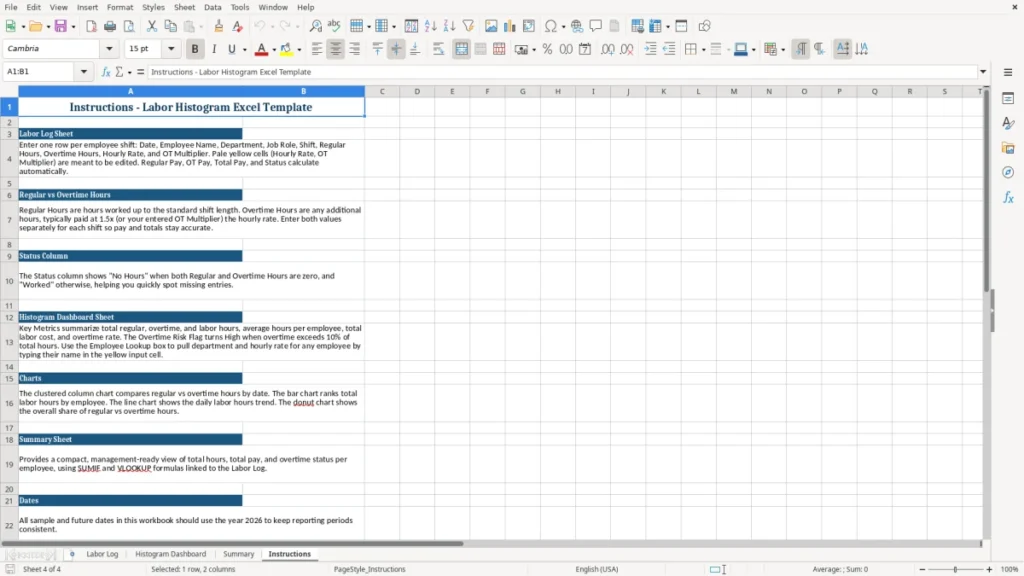
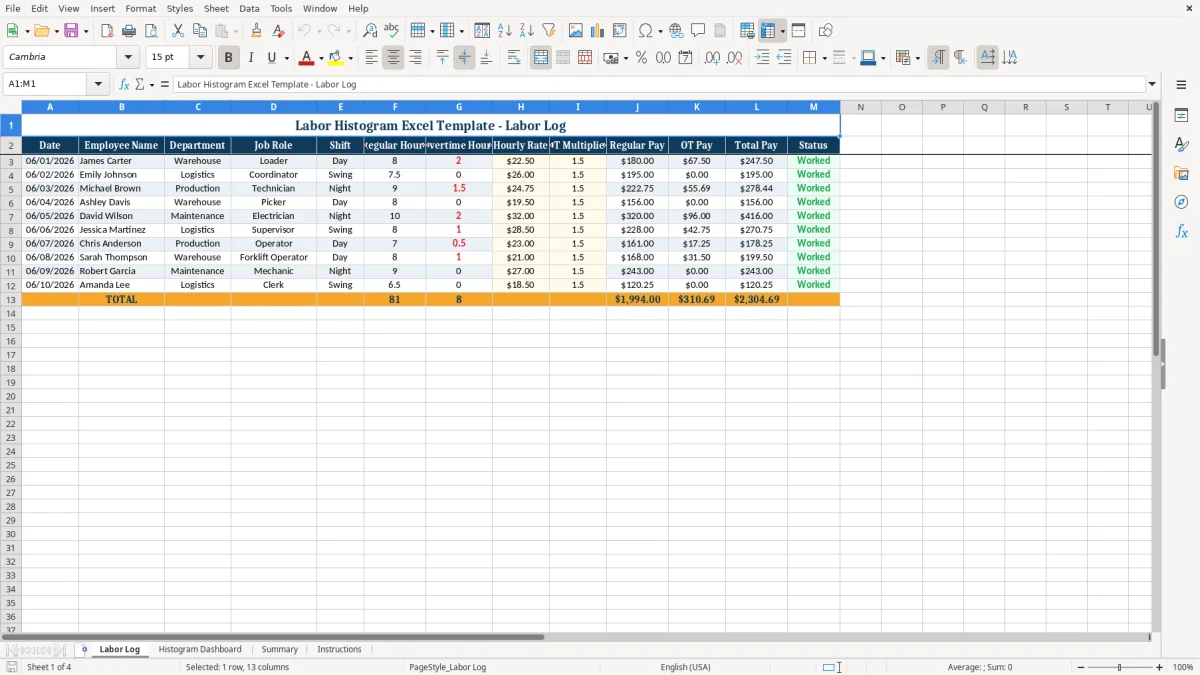
This labour histogram Excel template tracks daily hours, overtime, and pay in a labor log, then turns the data into a histogram dashboard and summary sheet. It includes four sheets: Labor Log, Histogram Dashboard, Summary, and Instructions.
Use it when you need a quick view of where labor hours are concentrated across shifts, departments, and job roles. The workbook is built for a small crew, like a 4-person contractor team or a warehouse with rotating day, swing, and night shifts.
The Labor Log sheet captures the input data, the dashboard shows the distribution visually, and the Summary sheet rolls up the totals so you can see regular hours, overtime hours, and total pay without building formulas from scratch.
The main benefits of this Excel template
- Tracks regular hours and overtime hours in one place, so you can spot a 2-hour overtime spike before payroll runs.
- Shows labor concentration by shift and department, which helps when a 6-person team keeps piling up hours on night work.
- Separates regular pay, OT pay, and total pay, making payroll review faster and easier to audit.
- Gives you a histogram dashboard instead of a raw table, so hour patterns are visible at a glance.
- Helps you compare employees side by side, which is useful when one loader logs 10 hours and another logs 7.5.
- Supports weekly or daily tracking without needing software, which is practical for small crews and seasonal work.
- Creates a cleaner month-end review by pulling the data into a Summary sheet with totals and counts.
Step-by-step guide
- Open the Labor Log sheet and enter each work entry on its own row. Fill in the date, employee name, department, job role, shift, and hours worked.
- Review the overtime fields before you save the file. If an employee works 10 regular hours and 2 overtime hours, the pay lines should reflect that split clearly.
- Check the OT multiplier and hourly rate for each worker. A $22.50 rate with a 1.5 multiplier should calculate overtime pay differently from a $32.00 rate.
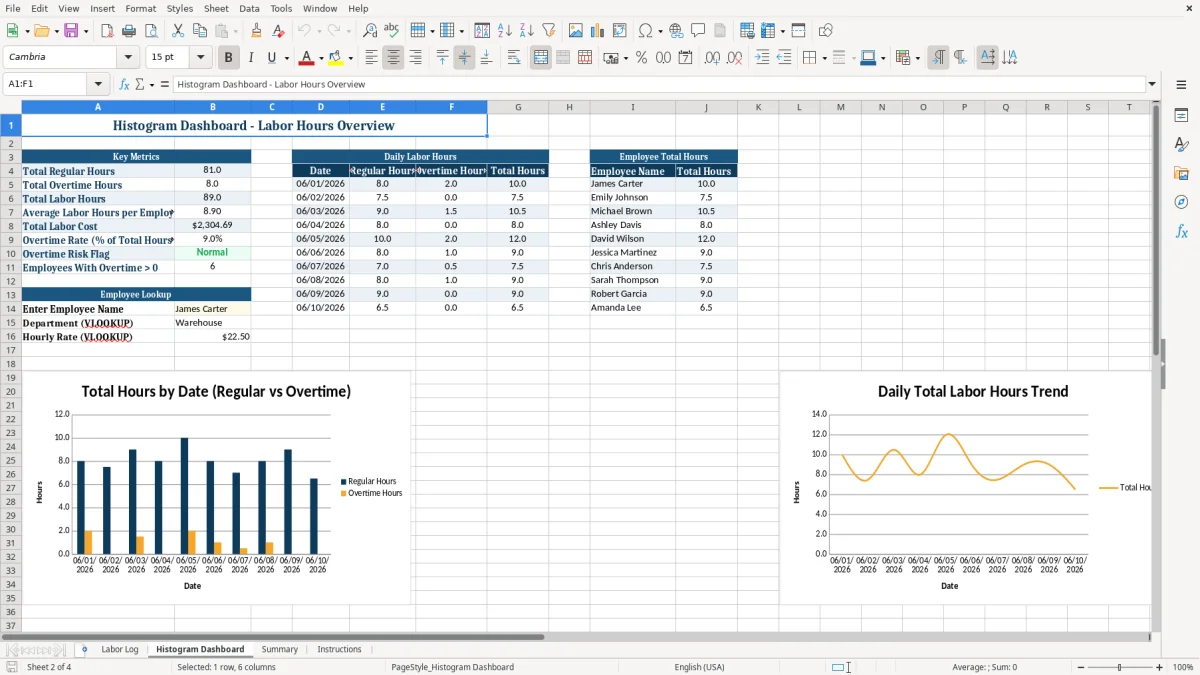
- Move to the Histogram Dashboard sheet to review the labor distribution. Use it to see which shifts or roles are taking the most hours.
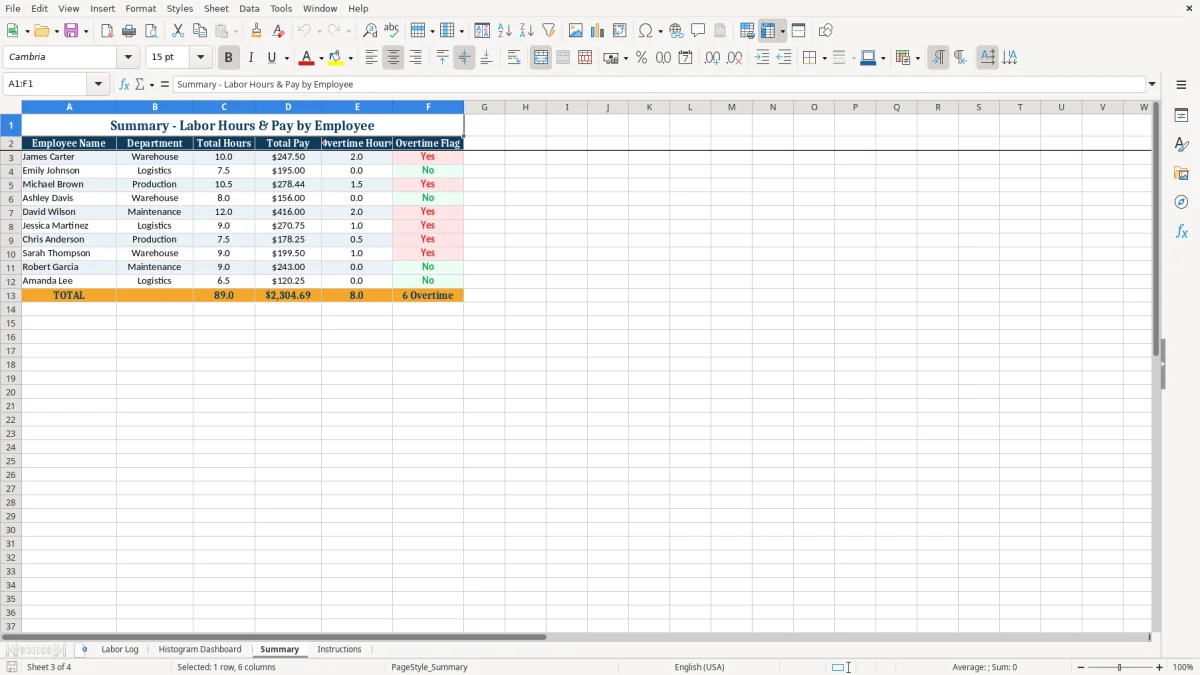
- Open the Summary sheet to confirm total regular hours, overtime hours, and pay amounts. This is the sheet you use for a quick payroll check.
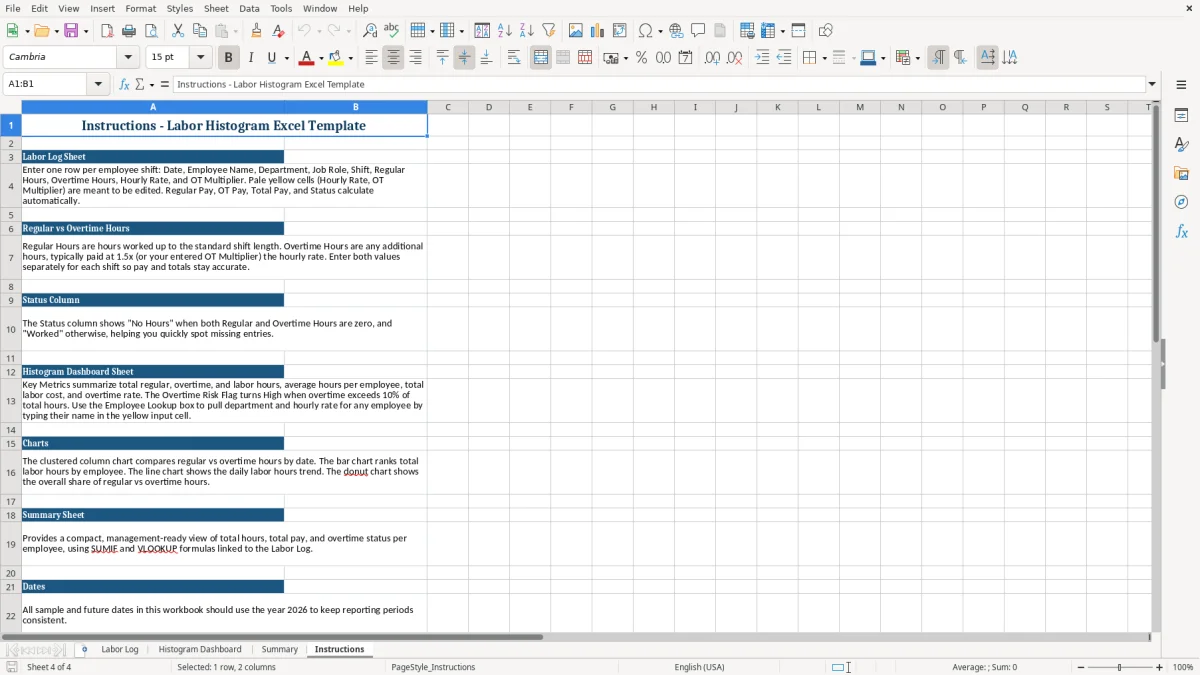
- Read the Instructions sheet if you need a reminder on how the workbook is organized. It is also useful when someone else takes over the file.
- Update the log every day or every pay period, then save a copy at month end. That keeps the dashboard current and makes the next review faster.
What is included
Labor Log sheet with columns for date, employee name, department, job role, shift, regular hours, overtime hours, hourly rate, OT multiplier, regular pay, OT pay, total pay, and status.
Histogram Dashboard sheet that turns the labor data into a visual summary of hour distribution.
Summary sheet that pulls together totals for payroll review and workforce tracking.
Instructions sheet that explains how to use the workbook without guessing.
Built-in pay fields that separate regular pay from OT pay for cleaner review.
Color-coded table styling that makes the input area easier to scan row by row.
Designed for practical crew tracking in operations like warehouse, logistics, production, and maintenance.
Who uses a labour histogram Excel template in daily operations
This workbook fits the people who actually track labor by hand: an office manager at a contractor, a payroll clerk at an LLC, a warehouse lead, or a nonprofit treasurer watching volunteer and paid shifts. If you have 4 employees on rotation and one of them keeps running 2 hours over on Fridays, the histogram shows the pattern before payroll gets messy.
The Labor Log sheet makes the raw entry work simple. You record the date, employee name, department, job role, shift, regular hours, overtime hours, hourly rate, OT multiplier, and the pay fields, then the dashboard and summary sheets turn that into something you can read in 30 seconds.
For small crews and rotating shifts
A 10-person shop with day, swing, and night shifts does not need enterprise software to see labor concentration. If night shift is carrying 42 hours while day shift is at 28 hours, you can tell where coverage is leaning and whether overtime is creeping in.
For payroll review before the pay run
Use this right before payroll is finalized, not after. If one technician logs 9 regular hours and 1.5 overtime hours at $24.75 per hour, the template gives you a clean way to check the pay lines before money goes out.
For month-end labor review
At month end, the Summary sheet helps you compare departments and roles without rebuilding totals. That matters when you are trying to decide whether a warehouse picker, loader, or supervisor is driving the extra labor cost.
What the IRS and payroll rules mean for labor tracking
This file is a labor tracker, not a payroll tax return, but the numbers still matter. If a worker is a non-exempt employee under the FLSA, overtime is generally 1.5x the regular rate over 40 hours in a workweek, and your log needs to show the split clearly.
For payroll reporting, employee wages are subject to FICA: Social Security at 6.2% and Medicare at 1.45% on the employee side, with matching employer taxes. A $1,000 gross paycheck therefore carries $76.50 in employee FICA and the same employer-side amount before other deductions.
Why the hourly split matters
If an employee earns $22.50 per hour and works 8 regular hours plus 2 overtime hours, the overtime rate is $33.75 before taxes. That is a $22.50 difference on just one overtime hour, and on a 20-person weekly payroll that adds up fast.
Recordkeeping you should keep
The IRS generally expects payroll and employment records to be kept for at least 3 years, and longer in some cases. Keep your labor log, time approvals, and payroll support together so a year-end question is answered from one file instead of three spreadsheets and a file cabinet.
Worker classification is not a guess
If you are paying a person like an employee, use employee tracking. A true 1099 contractor is not handled the same way as a W-2 worker, and mixing those up can create back taxes and penalty problems that cost far more than the spreadsheet itself.
Those classification records also feed the labor line in a residential construction budget, where employee pay and contractor costs need to stay separated from the start.
Where labor logs break down and what that costs
The biggest failure is simple: hours get entered late or copied wrong. If one shift is entered as 8.0 instead of 10.0, and the worker should have had 2 overtime hours at time-and-a-half, you can underpay the employee by $67.50 on a $22.50 rate before taxes.
Missed overtime becomes an expensive fix
One missed overtime line looks small, but a 12-week period with just 1 bad entry per week can create $500 or more in wage corrections, depending on the rate. If you are handling payroll for a 4-person crew, those corrections eat time twice: once to find the error and again to reissue the check.
Bad shift coding hides the real pattern
If day, swing, and night shifts are all lumped together, the histogram stops being useful. A supervisor may think labor is balanced when night shift is actually absorbing 14 extra hours a week, which can mean burnout, higher turnover, and more overtime in the next pay period.
Payroll review gets slowed down by messy input
Missing department names, blank status fields, and inconsistent job roles create cleanup work at every close. In a month with 120 labor rows, even 5 minutes of correction per bad row becomes a full hour of admin time, and that is before payroll or management asks for a recap.
That same cleanup often starts with a time-off tracker so blank status fields and holiday entries are captured before payroll review begins.
How to make the labour histogram part of your routine
Do the update at the same time every week, ideally right before payroll or the weekly schedule review. If you enter 20 rows on Friday afternoon, the dashboard stays current and you avoid the Monday scramble when everyone is trying to remember who worked what.
Build it into an existing closeout
- Copy the prior week’s entries and change only the new dates, names, and hours.
- Review overtime and status fields before you close the pay period.
- Use the Summary sheet as your final check against payroll totals.
- Save a PDF snapshot of the dashboard at month end if you need a record for management.
Keep the input clean
Use fixed dropdown-style entries for department, shift, and status if you can. Clean input means the histogram groups correctly, and you do not end up with “Warehouse” in one row and “warehouse” in another.
Know when to move on
If you are over 500 labor rows a month, or you need time clocks, PTO balances, and job costing tied together, a spreadsheet starts to run out of room. At that point, payroll or workforce software is the better tool, but this workbook is still the right fit for smaller teams and manual review.
Frequently asked questions about this template
It is used to log hours, overtime, and pay, then show the labor distribution in a histogram dashboard. That makes it easier to see where hours are concentrated by employee, shift, department, or job role.
The workbook includes four sheets: Labor Log, Histogram Dashboard, Summary, and Instructions. The Labor Log is the input sheet, and the other sheets turn that data into a visual and a quick review view.
Yes. The log includes separate fields for regular hours, overtime hours, hourly rate, OT multiplier, regular pay, OT pay, and total pay, so you can review the split before payroll is finalized.
Yes. It works well for a small crew with weekly or biweekly payroll, especially when you want a simple record of who worked what without buying software. A 4-person or 10-person team is exactly the kind of setup this file handles well.
The histogram shows how labor hours are distributed, so you can spot heavy shifts, overused roles, or uneven staffing. If one shift keeps landing 10 to 15 hours above the others, the chart makes that obvious fast.
Move on when the file starts handling too many rows, too many users, or too many linked tasks like time clocks and PTO. If you are reviewing 500+ labor entries a month, software will usually save more time than a manual workbook.
Meet the makers