
HR & Payroll


Employee Performance KPI Excel - Free Template
Track employee KPIs, targets, actuals, ratings, weighted scores, and review status with an Excel workbook for managers and HR teams.
2026-09-12
388 downloads
4.8/5
Download template
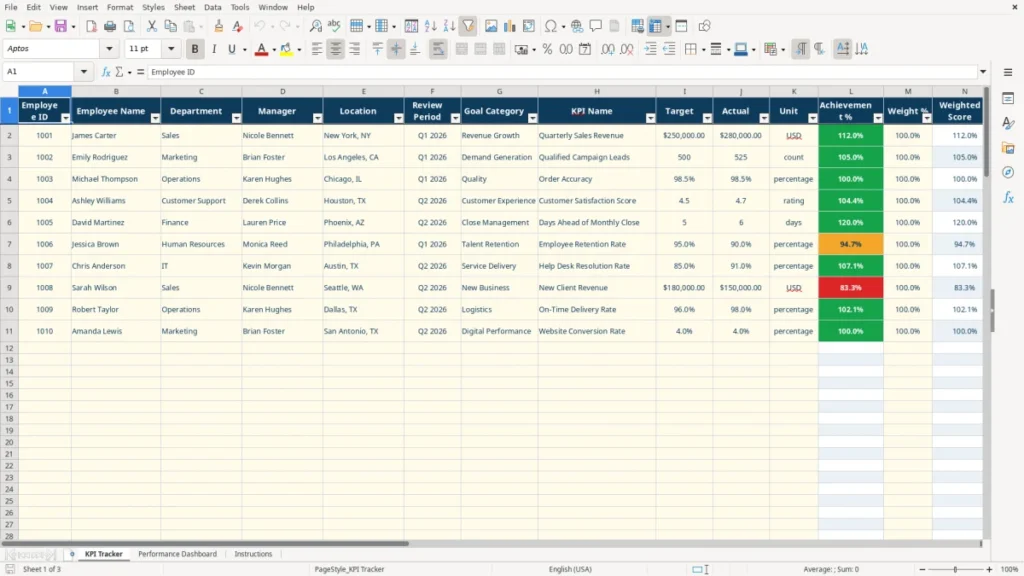
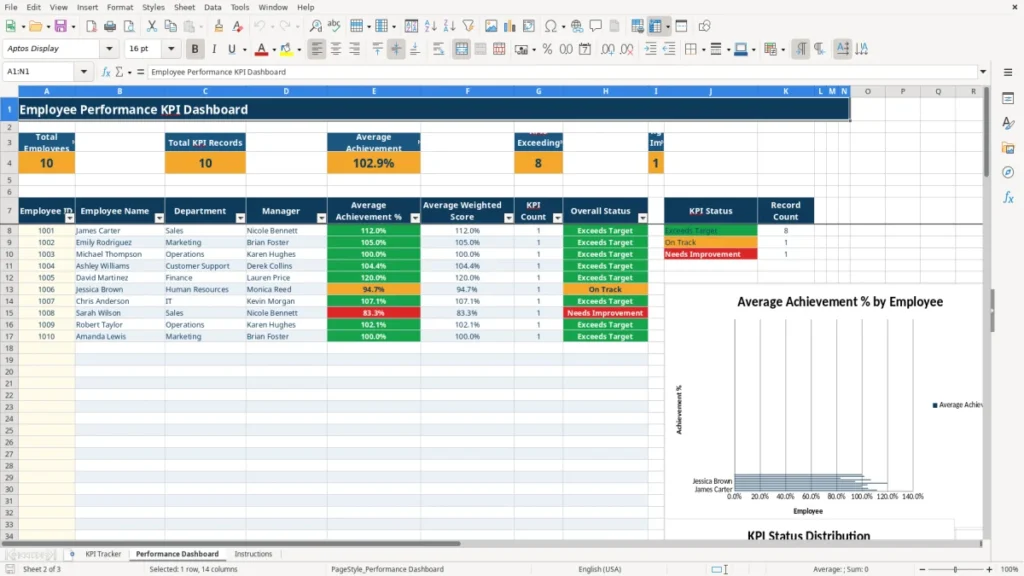
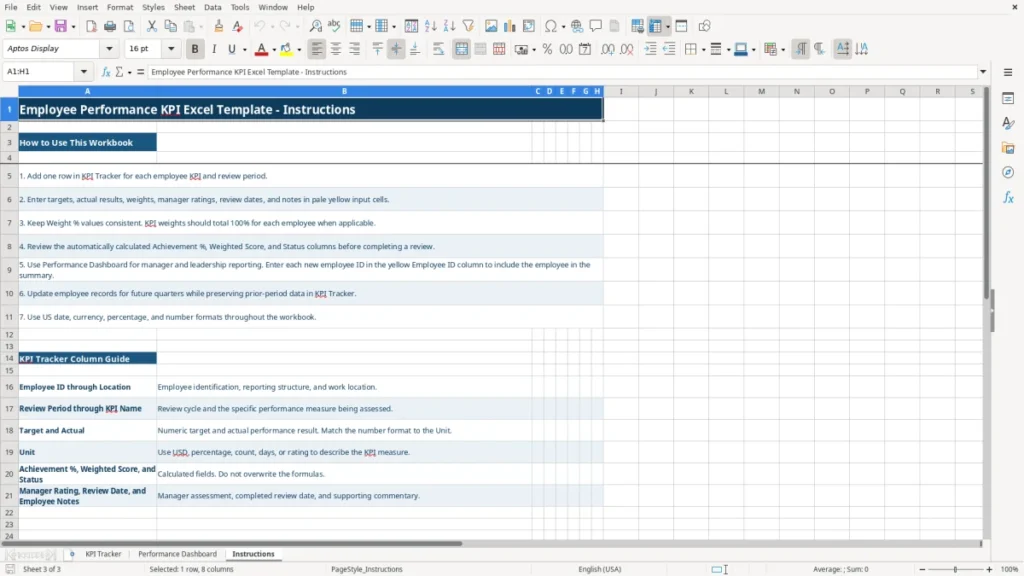
An employee performance KPI Excel template records each employee's targets, actual results, achievement percentage, weighted score, manager rating, review date, and notes. It includes a 100-row KPI Tracker, a calculated Performance Dashboard, and an Instructions sheet for setting up quarterly reviews.
Enter one row for each employee KPI and review period. The workbook calculates achievement percentage, weighted score, and status automatically, while the dashboard summarizes employee results and KPI categories for manager and leadership discussions.
Image 1 shows the KPI Tracker with 18 columns from Employee ID through Employee Notes. Image 2 shows the dashboard summary, employee-level results, status counts, and two charts; image 3 shows the field guide and setup instructions.

The main benefits of this Excel template
- Record up to 100 KPI rows with employee, manager, department, location, review period, and KPI details.
- Calculate achievement percentage from Actual divided by Target without manually editing formula cells.
- Apply a weight from 0% to 100% and calculate each KPI's weighted score automatically.
- Classify results as Exceeds Target, On Track, or Needs Improvement using the workbook's 100% and 90% thresholds.
- Summarize total employees, KPI records, average achievement, exceeding KPIs, and improvement-needed KPIs on one dashboard.
- Compare employees by average achievement, average weighted score, KPI count, and overall status.
- Keep manager ratings, review dates, and employee notes beside the quantitative KPI record.
Step-by-step guide
- Open the Instructions sheet and review the column guide before entering new performance data.
- On KPI Tracker, add one row for each employee KPI and review period. Complete Employee ID through KPI Name, then enter the Target, Actual, Unit, and Weight % in the pale yellow input cells.
- Use the available lists for department, quarter, and unit. Enter a weight between 0 and 1, such as 0.25 for 25%, and keep an employee's KPI weights consistent with the intended 100% total.
- Enter the Manager Rating from 1 to 5, a valid Review Date, and supporting Employee Notes. Do not replace the formulas in Achievement %, Weighted Score, or Status.
- Check the calculated results. Achievement % equals Actual divided by Target, Weighted Score equals Achievement % multiplied by Weight %, and status changes at 90% and 100% achievement.
- On Performance Dashboard, enter each employee ID in the yellow Employee ID area. Review the employee summary, KPI status counts, dashboard metrics, and charts before the performance meeting.
- For a new quarter, add new KPI Tracker records while preserving prior-period rows. Keep the workbook's US currency, percentage, number, and date formats consistent.

What is included
KPI Tracker with Employee ID, Employee Name, Department, Manager, Location, Review Period, Goal Category, and KPI Name fields.
Target, Actual, Unit, Weight %, Manager Rating, Review Date, and Employee Notes input fields for each performance record.
Formula-driven Achievement %, Weighted Score, and Status columns across rows 2 through 101.
Department, review-period, unit, weight, rating, and date validation to reduce inconsistent entries.
Performance Dashboard with total employees, total KPI records, average achievement, exceeding-target KPIs, and improvement-needed KPIs.
Employee summary using VLOOKUP, AVERAGEIF, and COUNTIF, plus KPI status counts for Exceeds Target, On Track, and Needs Improvement.
Two dashboard charts: employee average achievement and KPI status record counts.
Who uses an employee performance KPI spreadsheet during the year
An employee performance KPI spreadsheet is useful for an HR coordinator, department manager, operations lead, or owner of an LLC that does not need a full performance-management system. The practical use point is the quarterly review: enter the target and actual result after the quarter closes, add the manager rating, and use the dashboard before the one-on-one meeting.
Quarterly reviews for small teams
Consider a contractor with 4 employees. The sales employee may have a quarterly revenue target of $250,000 and an actual result of $280,000. The template calculates 112% achievement and labels the record Exceeds Target. A customer-support employee might have a target of 50 resolved cases per week and an actual of 46, producing 92% achievement and an On Track status.
The KPI Tracker is arranged for one record per employee KPI and review period. That matters when one employee has several measures: revenue, qualified leads, order accuracy, response time, or another defined goal should occupy separate rows rather than being forced into one blended note.
Manager and leadership reporting
Image 1 shows the 18-column entry sheet, including Employee ID, Department, Manager, Goal Category, Target, Actual, and Unit. Image 2 shows the dashboard's employee summary with average achievement, average weighted score, KPI count, and overall status. The dashboard is useful at month-end or quarter-end because leadership can see whether a problem affects one employee or an entire department.
For example, an employee with three KPI records at 105%, 98%, and 85% has a simple average achievement of 96%. That number supports a focused conversation about the 85% result rather than relying on an overall impression.

How the KPI calculations support a defensible review process
The workbook uses transparent Excel calculations rather than a hidden scoring model. In KPI Tracker, achievement percentage is calculated as Actual divided by Target. If Target is $250,000 and Actual is $280,000, the result is 112%, or 1.12 as the underlying ratio.
Thresholds and weighted scores
The Status formula classifies achievement at three points: 100% or more is Exceeds Target, 90% through less than 100% is On Track, and below 90% is Needs Improvement. These are workbook thresholds, not an IRS or federal employment-law standard. A result of 89% therefore receives Needs Improvement even if the manager believes the surrounding circumstances deserve discussion.
Weighted Score equals Achievement % multiplied by Weight %. If a KPI reaches 112% with a 40% weight, its weighted score is 44.8%. If three KPI weights are 40%, 35%, and 25%, they total 100%, which gives the review a complete weighting structure. Keep weights consistent for the same employee and review period.
Inputs, validation, and review evidence
The sheet restricts Weight % to 0 through 1 and Manager Rating to 1 through 5. The Unit list includes USD, percentage, count, days, and rating, while Review Period offers Q1 2026 through Q4 2026. Use the matching number format: $250,000.00 for revenue, 98.5% for an accuracy measure, or 46 for a count.
Image 3 explains that Achievement %, Weighted Score, and Status are calculated fields and should not be overwritten. Keep the review date and employee notes because a score without the measurement date or supporting context is weak evidence in a later compensation or coaching discussion.
Where employee KPI tracking breaks down in real reviews
The first expensive mistake is mixing units. If a target is entered as 98.5% but the actual is entered as 0.985, the values are compatible only when both cells use the same underlying scale. If Target is 98.5 and Actual is 0.985, the formula produces 1%, making a strong accuracy result look like a failure.
Bad targets create bad conversations
A sales manager may enter $250,000 as a target and $280,000 as actual, while another manager enters 500 and 525 for qualified leads. Those are valid different units, but changing a target halfway through Q1 makes the 112% result impossible to compare with the original plan. Document the approved target in the notes rather than silently replacing it.
Weights are another frequent failure point. If four KPIs are entered with weights of 25%, 25%, 25%, and 25%, the structure is clear. If the same employee receives 50%, 50%, and 50%, the weighted scores can total 150%, overstating the review. The Instructions sheet specifically tells you to keep weights consistent and, when applicable, total them to 100%.
Duplicate records and stale summaries
The dashboard counts KPI records from the tracker and looks up employee details by Employee ID. If employee ID 1001 is entered twice for the same KPI and quarter, the dashboard counts both records; it does not decide which row is the duplicate. A duplicate $20,000 sales record can make a quarterly result appear $40,000 higher than the source evidence.
The dashboard also requires employee IDs in its prepared summary area. If you add a new employee to KPI Tracker but do not add that ID to the dashboard's yellow input area, the tracker contains the record while the employee summary does not show it. Check both sheets before presenting results.
How to make quarterly KPI tracking a repeatable management routine
Use the same calendar trigger every quarter: after the final business day, collect actual results, update KPI Tracker, and complete the manager rating within five business days. A 4-employee team with 3 KPIs each creates 12 rows per quarter, so a fixed Friday review routine is manageable and easier to maintain than rebuilding a report before every meeting.
A practical update sequence
- Copy the approved targets and KPI names from the prior quarter, then change only the Review Period and confirmed targets.
- Enter Actual results from the source report, such as $280,000 in booked revenue, 525 qualified leads, or 98.5% order accuracy.
- Check that each Unit matches the number entered and that an employee's weights total 100% where applicable.
- Enter the Review Date and a short Employee Note explaining an unusual result, target change, or completed action.
- Update every employee ID in the dashboard input area and compare the summary with the tracker record count.
When the spreadsheet is no longer enough
This workbook is a practical choice for a small team with up to 100 KPI rows and a quarterly process. Move to dedicated performance software when you need employee self-service, approval history, permissions, automated reminders, change logs, or more than 100 prepared tracker rows. Do not solve a control problem by adding more manual tabs; first establish one approved source for targets and actuals.
Protect calculated columns from casual edits and keep a dated copy after each completed quarter. That preserves the figures used in the review without changing the formulas that produce achievement, weighted score, or status.
Frequently asked questions about this template
It calculates Achievement % as Actual divided by Target, Weighted Score as Achievement % multiplied by Weight %, and Status as Exceeds Target, On Track, or Needs Improvement. The dashboard also calculates employee averages and KPI status counts.
The KPI Tracker has prepared rows 2 through 101, providing 100 operational rows. Use one row for each employee KPI and review period rather than combining several KPIs in one row.
Achievement of 100% or more is Exceeds Target. Achievement from 90% through less than 100% is On Track, and achievement below 90% is Needs Improvement.
Yes. The Unit validation list includes USD, percentage, count, days, and rating. Enter Target and Actual using the same underlying scale; for example, use 0.985 for both values when calculating a 98.5% result.
Enter the employee's ID in the dashboard's prepared Employee ID area. The dashboard uses that ID to retrieve the name, department, manager, averages, KPI count, and overall status from KPI Tracker.
No. Leave Achievement %, Weighted Score, and Status unchanged. Enter data in the input fields, including targets, actuals, weights, manager ratings, review dates, and notes, then review the calculated outputs.
Meet the makers