
HR & Payroll


QA Scorecard Excel - Free Template
Score customer interactions with weighted QA criteria, pass/fail results, reviewer fields, and a dashboard for team performance.
2026-07-30
319 downloads
4.8/5
Download template
A QA scorecard Excel template is a structured worksheet for evaluating customer calls and other interactions against consistent quality standards. This file contains a QA Scorecard with six weighted criteria, automatic overall scoring and pass/fail results, a Summary Dashboard, and an Instructions sheet.
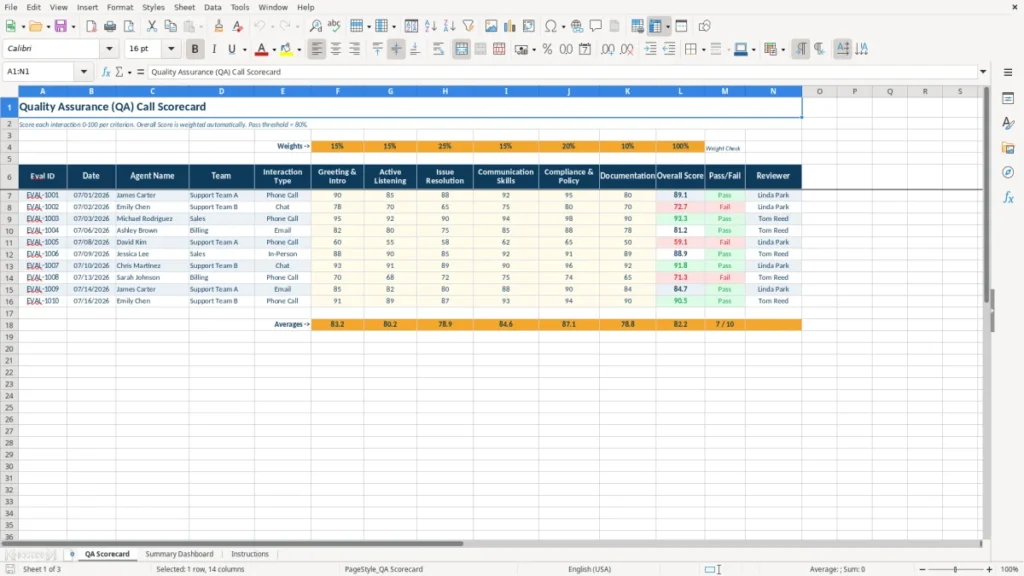
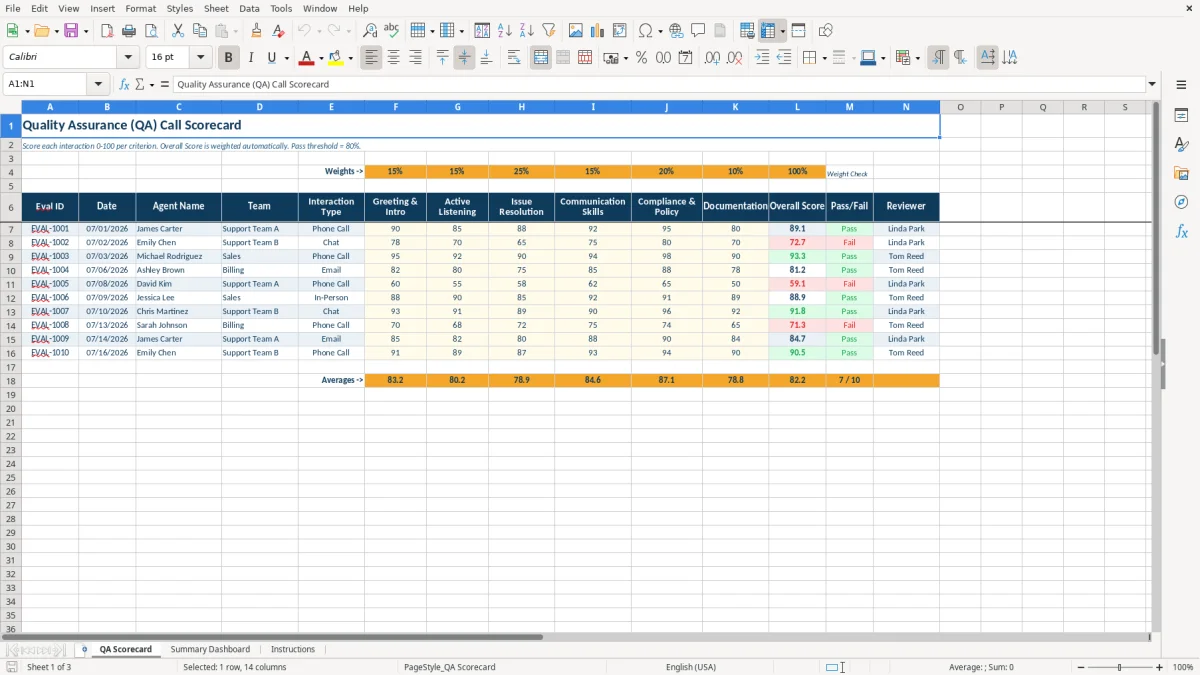
The QA Scorecard sheet (image 1) records the evaluation ID, date, agent, team, interaction type, reviewer, and individual ratings for greeting, listening, resolution, communication, compliance, and documentation. The scoring guidance uses a 0-100 scale and an 80% pass threshold.
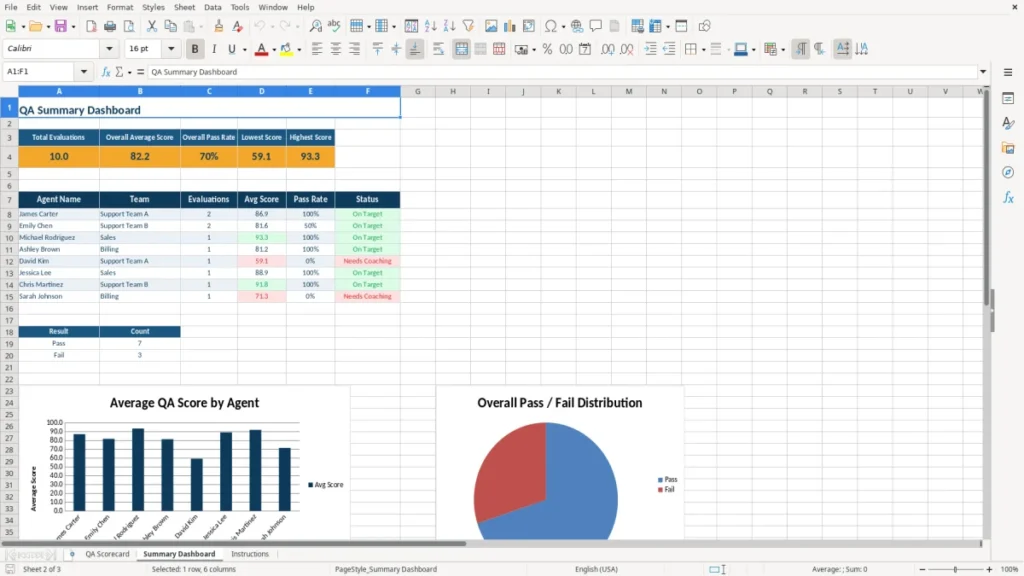
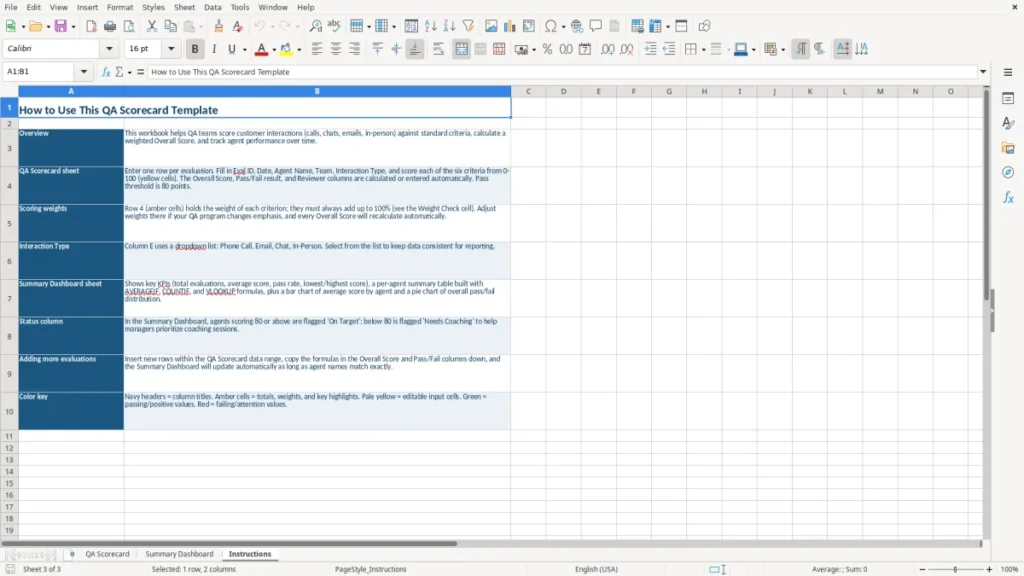
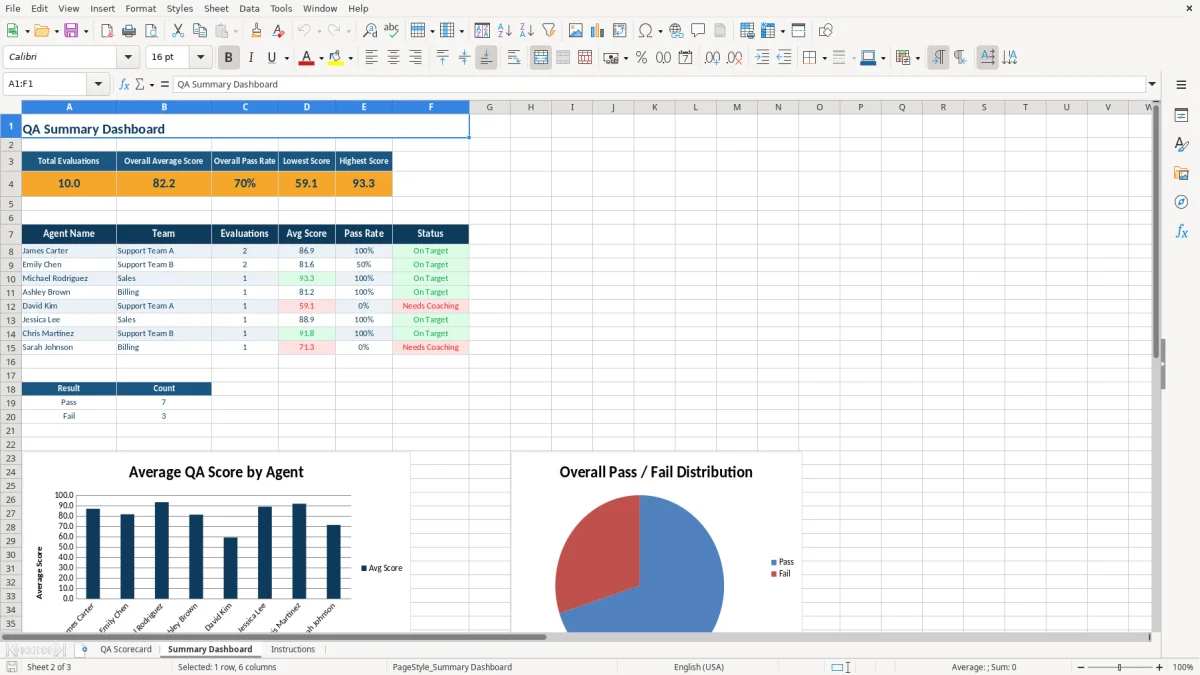
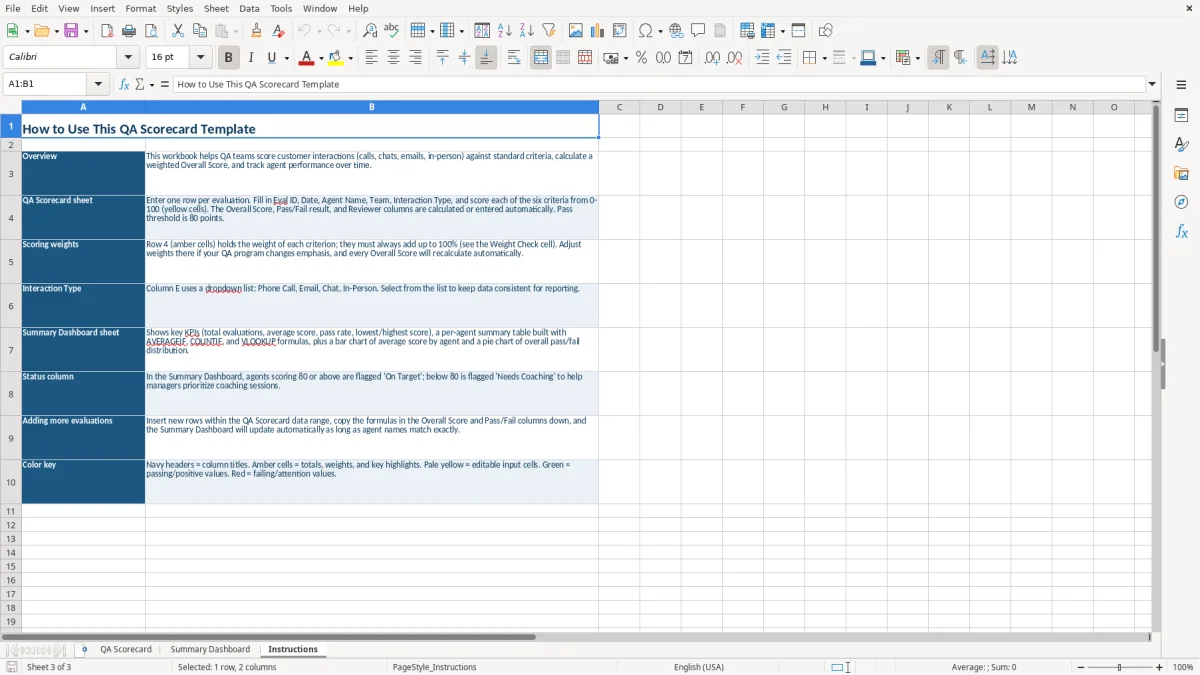
The Summary Dashboard (image 2) gives you a management view of results, while Instructions (image 3) explains the intended workflow. Use the file for weekly coaching, monthly quality reviews, new-hire calibration, or a larger quality assurance program.
The main benefits of this Excel template
- Apply the same six QA criteria to every interaction instead of relying on reviewer memory.
- Use weighted scoring so Issue Resolution contributes 25%, more than the 10% Documentation category.
- See whether an evaluation passes the built-in 80% threshold without calculating the result manually.
- Record Eval ID, date, agent, team, interaction type, and reviewer so each score has an audit trail.
- Compare performance across agents and teams during weekly coaching or monthly quality meetings.
- Identify whether a low result comes from communication, compliance, listening, resolution, or another specific category.
- Give supervisors a consistent workbook for call calibration without requiring a specialized QA platform.
Step-by-step guide
- Open the Instructions sheet (image 3) and review the scoring approach before entering evaluations. Confirm that your supervisors will use the same 0-100 interpretation for each criterion.
- Go to QA Scorecard (image 1) and create one row for each reviewed interaction. Enter the Eval ID, Date, Agent Name, Team, Interaction Type, and Reviewer.
- Score Greeting & Intro, Active Listening, Issue Resolution, Communication Skills, Compliance & Policy, and Documentation from 0 to 100 based on the interaction evidence.
- Review the weights shown in the worksheet. The six percentages are 15%, 15%, 25%, 15%, 20%, and 10%, so the overall result reflects the relative importance assigned to each criterion.
- Check Overall Score and Pass/Fail after entering the criterion scores. A result of 80% or higher meets the displayed pass threshold; investigate the individual category scores before coaching the agent.
- Open Summary Dashboard (image 2) after several evaluations have been recorded. Use the visual summary to discuss team patterns rather than treating one isolated call as a performance trend.
- Save a dated copy after each review cycle and restrict editing access if the workbook contains agent names, customer details, or other confidential employment information.
What is included
QA Scorecard sheet with columns for Eval ID, Date, Agent Name, Team, Interaction Type, six scoring categories, Overall Score, Pass/Fail, and Reviewer.
Weighted criteria that assign 15% to Greeting & Intro, 15% to Active Listening, 25% to Issue Resolution, 15% to Communication Skills, 20% to Compliance & Policy, and 10% to Documentation.
0-100 scoring guidance shown directly below the title, with an 80% pass threshold for the evaluation result.
Automatic overall scoring that combines the six criterion ratings according to the displayed weights.
Pass/Fail output that lets you identify evaluations meeting or missing the 80% standard.
Summary Dashboard for reviewing the recorded QA results in a management-friendly layout.
Instructions sheet that gives users a defined starting point before they complete the scorecard.
Who uses a QA scorecard Excel template during the workweek
A contact center supervisor, customer support manager, or outsourced service provider usually needs this worksheet after a sample of calls has been reviewed. A practical routine is to evaluate five interactions per agent each week, then discuss the results during a 15-minute coaching session instead of waiting for a quarterly performance review.
For example, a support team with 12 agents and five evaluations per agent creates 60 scorecard rows each week. If four supervisors split the work, each person reviews 15 interactions. The Eval ID, Date, Agent Name, Team, Interaction Type, and Reviewer columns make it possible to trace a result back to a particular call or chat.
Use it for calibration, not just grading
Two reviewers can hear the same call and assign different scores unless they agree on what 70, 85, or 100 means. Use the Instructions sheet (image 3) to establish examples before the first review, then have two reviewers independently score the same three calls. A five-point difference on a 100-point scale is a useful signal that your rubric needs clarification.
Match the review to the interaction
The Interaction Type field matters when your team handles billing calls, technical support, sales inquiries, and cancellations. A 95 for Greeting & Intro does not prove that a billing representative explained a disputed $240 charge correctly. Review the category that reflects the actual work, especially Issue Resolution and Compliance & Policy.
The Summary Dashboard (image 2) becomes more useful once you have at least 20 to 30 completed evaluations. Before that point, use the rows for individual coaching and use the dashboard cautiously because one unusually poor call can materially change a small average.
At that point, a risk assessment worksheet becomes the next step for documenting which call outcomes carry the highest compliance exposure.
The US rules behind call quality monitoring
A QA scorecard is an internal management tool, but the recordings and notes behind it can involve employment, privacy, and consumer-protection rules. The FLSA sets the federal minimum wage at $7.25 per hour and generally requires overtime at 1.5 times the regular rate after 40 hours in a workweek for covered, nonexempt employees. Reviewing calls cannot replace accurate timekeeping or create unpaid work before or after a shift.
Call recording is a separate issue from scoring. Federal law generally uses a one-party consent standard, while states such as California generally require all-party consent for a confidential call. A recorded customer service call that crosses state lines can create risk if your notice says this call may be recorded but does not satisfy the applicable consent requirement. Put the approved disclosure in the operating procedure rather than assuming the spreadsheet solves it.
Keep performance data limited
Agent names, evaluation comments, call IDs, and customer details may be employment or personally identifiable information. California businesses covered by the CCPA and CPRA have specific obligations involving personal information, access, deletion, and security. Do not paste full SSN, payment-card, medical, or authentication data into the QA Scorecard; use a call ID and keep the source system restricted.
Document a defensible process
Use the same criteria and 80% threshold for similarly situated agents unless a written role-specific rubric explains the difference. A score of 78% and a score of 82% are only meaningful if the reviewers applied the same evidence standard. Keep the completed workbook, scoring definitions, reviewer identity, and coaching response according to your retention policy; a 12-month retention period is a workable starting point for many teams, but regulated records may require longer storage.
My practical preference is to store the workbook in a permission-controlled business location, not on a shared personal desktop. The template tracks results; it does not provide consent language, legal notices, access controls, or a complete personnel-file system.
Where QA scoring breaks down and what it costs
The most expensive failure is inconsistent scoring. One supervisor may give 90 for a call that another supervisor rates 72 because the first reviewer rewards a friendly tone while the second focuses on an incomplete resolution. Across 60 weekly evaluations, a 10-point reviewer gap can move an agent from clear coaching territory to an apparent pass without any change in customer service.
Weights can hide a serious defect
The file weights Issue Resolution at 25% and Compliance & Policy at 20%. Consider scores of 95, 90, 92, 88, 60, and 90: the weighted result is 83.85%, so the evaluation passes the 80% threshold even though compliance is weak. That is not a spreadsheet error. It is a management decision that requires a rule such as an automatic compliance fail when a critical disclosure is missed.
Manual totals create avoidable disputes
If a reviewer adds six scores by hand, a single transposed number can change a result. With scores of 80, 80, 80, 80, 80, and 80, the answer should be 80%; entering 88 for one category produces a different outcome and may trigger unnecessary coaching. Use the calculated Overall Score and inspect the source ratings instead of overwriting the result.
Thin samples produce bad conclusions
An agent with one 65% evaluation and one 95% evaluation has a simple average of 80%, but that average does not establish a stable trend. A missed $500 refund authorization on one call may matter more than ten routine greetings, while a low Documentation score may reflect a broken workflow rather than poor behavior. Record the Interaction Type and review the category pattern before attaching a disciplinary consequence.
Another common problem is leaving Reviewer or Eval ID blank. Six anonymous rows cannot support a calibration conversation, a correction, or an explanation of why a score changed. The time cost is small—about two minutes per row—but reconstructing missing context at month-end can take several hours.
How to turn the scorecard into a weekly coaching routine
Attach the workbook to an existing management event instead of asking reviewers to remember it whenever they have spare time. A reliable setup is to select the calls on Monday, complete evaluations by Wednesday, and review the Summary Dashboard on Friday before the team coaching meeting.
Use a fixed review cycle
- Choose a consistent sample, such as five interactions per agent per week or 20 per month.
- Enter each row immediately after review, while the evidence is still fresh.
- Discuss the lowest category and one successful behavior, rather than reading every number aloud.
- Save a dated copy after the meeting so prior results remain available for trend comparisons.
For a 10-agent team at five evaluations each week, the process produces 200 rows in a typical four-week month. At that volume, use a naming convention such as QA_2026-07 and avoid inserting unrelated notes into score fields; consistent data is what makes the dashboard useful.
Keep entries clean
Use the same spelling for team names and interaction types. If you add data validation to a working copy, use dropdowns for Team, Interaction Type, and Reviewer; this prevents entries such as Billing, billing, and Bill from becoming three apparent groups. Protect formula cells so a reviewer can enter scores without accidentally replacing Overall Score or Pass/Fail.
Know when to upgrade
This workbook is a good fit for one team with a manageable review queue. Move to a QA platform when you need automatic call sampling, recording playback, role-based permissions, immutable audit logs, appeal workflows, trend history across thousands of evaluations, or integrations with a contact-center system. If 20 supervisors are entering 1,000 rows a month, the control problem—not the score calculation—has outgrown Excel.
That control problem usually starts with a structured review score sheet, where each evaluation stays consistent before the volume gets large enough to outgrow Excel.
Frequently asked questions about this template
It measures six interaction criteria: Greeting & Intro, Active Listening, Issue Resolution, Communication Skills, Compliance & Policy, and Documentation. Each criterion uses a 0-100 score, and the workbook combines them into a weighted Overall Score.
The displayed pass threshold is 80%. The weighted result is classified as Pass when it meets that standard and Fail when it falls below it.
Greeting & Intro and Active Listening each carry 15%. Issue Resolution carries 25%, Communication Skills 15%, Compliance & Policy 20%, and Documentation 10%. The six weights total 100%.
Enter the Eval ID, Date, Agent Name, Team, Interaction Type, six criterion scores, and Reviewer. Use an internal call or case ID instead of pasting customer payment information, SSN, or other unnecessary sensitive data into the workbook.
Yes, it can support coaching and quality discussions, but it should be one part of a documented process. Apply the same rubric consistently, preserve the evidence behind a score, and follow your company rules for personnel records, call recording, and employee privacy.
Excel is practical for a small team and a moderate review volume. Consider dedicated QA software when you need automated call sampling, recording integration, role-based access, audit history, appeals, or reliable management of thousands of evaluations.
Meet the makers