
Accounting & Tax


IFRS financial statements Excel - Free Template
IFRS-style Excel template with trial balance, financial statements, equity reconciliation, dashboard metrics and management review checks.
2026-09-18
400 downloads
4.8/5
Download template
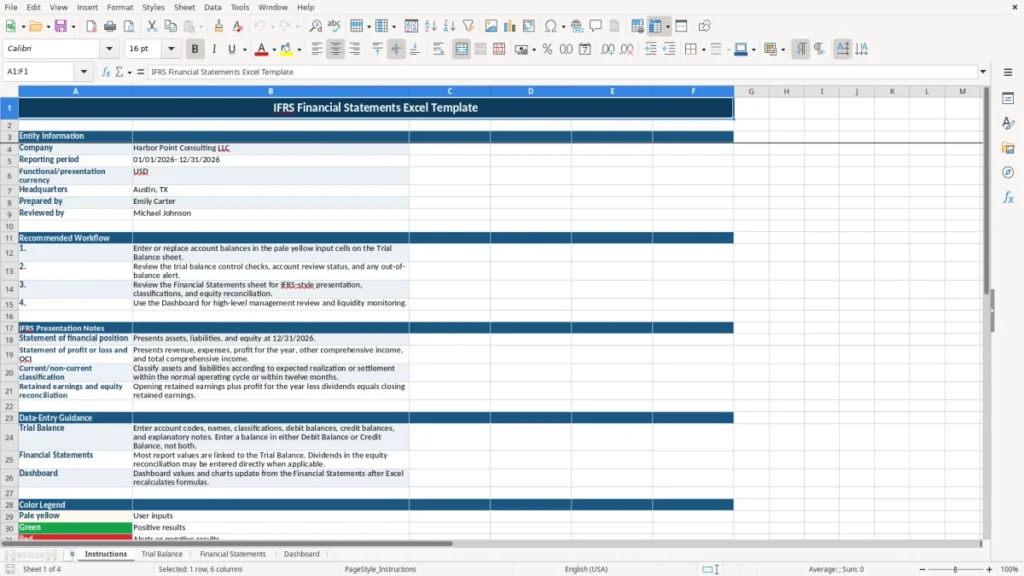
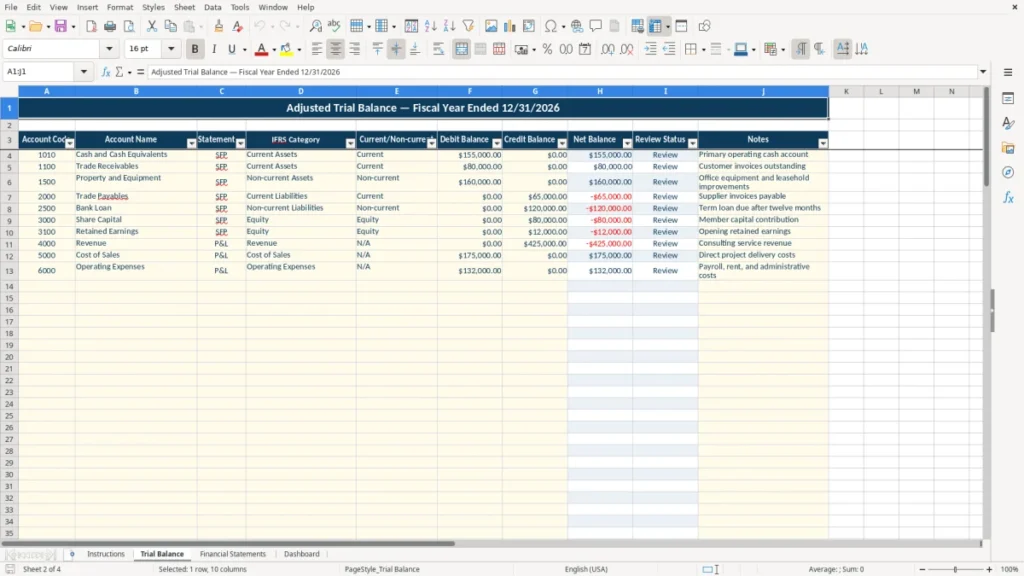
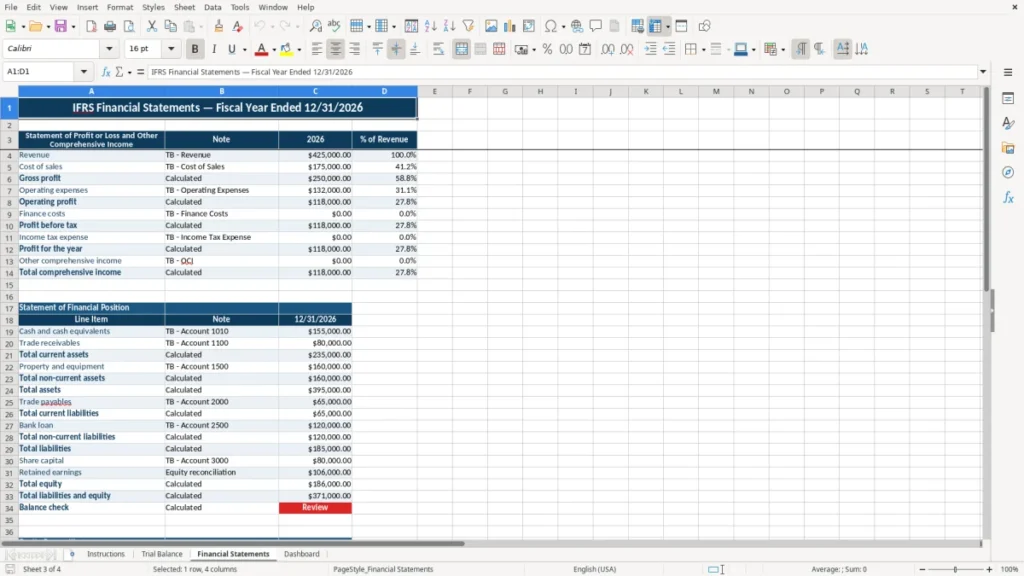
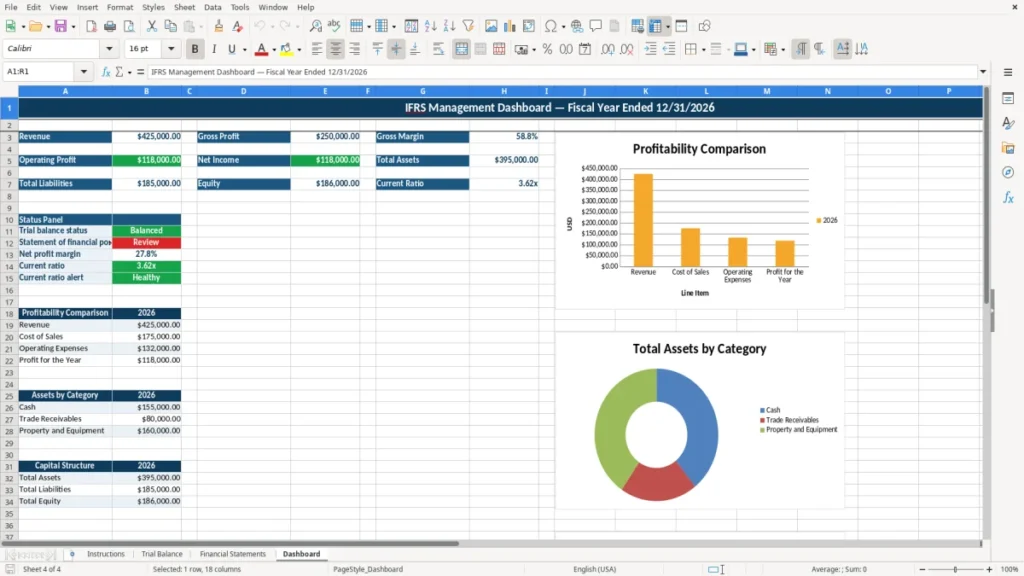
This IFRS financial statements Excel template converts classified trial balance balances into an IFRS-style statement of profit or loss and other comprehensive income, statement of financial position, equity reconciliation, and management dashboard. It contains four sheets: Instructions, Trial Balance, Financial Statements, and Dashboard.
You enter account codes, names, statement assignments, IFRS categories, current or non-current classifications, and debit or credit balances in the Trial Balance sheet. Linked formulas calculate totals, percentages, review statuses, liquidity measures, and presentation figures; the sample workbook is set to Harbor Point Consulting LLC for the year ended 12/31/2026 in USD.

The main benefits of this Excel template
- Maps up to 100 prepared trial balance rows to SFP, P&L, and OCI classifications.
- Separates debit and credit balances and calculates each account's net balance automatically.
- Flags an account as Review when the debit-minus-credit difference is at least $0.01.
- Produces revenue, cost of sales, gross profit, operating profit, profit for the year, OCI, and total comprehensive income.
- Presents current and non-current assets and liabilities with an equity reconciliation.
- Shows gross margin, net profit margin, current ratio, and balance-status indicators on the Dashboard.
- Includes three Dashboard charts for profitability, assets by category, and capital structure.
Step-by-step guide
- Open the Instructions sheet and replace the sample company, reporting period, currency, headquarters, preparer, and reviewer details.
- Go to Trial Balance and replace the sample account rows with your adjusted account data. Enter one balance in either Debit Balance or Credit Balance, not both.
- Assign each account to SFP or P&L, select an IFRS Category, and choose Current, Non-current, Equity, or N/A in the supplied list fields.
- Review Net Balance and Review Status for every populated row. Correct any row marked Review and inspect the control totals near the bottom of the sheet.
- Open Financial Statements and review the linked statement of profit or loss and other comprehensive income, statement of financial position, and equity reconciliation.
- Enter applicable dividends directly in the equity reconciliation, then confirm that closing retained earnings agrees with opening retained earnings plus profit for the year less dividends.
- Use Dashboard for management review. Confirm the trial balance and statement status, inspect liquidity alerts, and review the three charts after Excel recalculates.

What is included
Instructions sheet with entity information, workflow guidance, IFRS presentation notes, data-entry guidance, color legend, and disclaimer.
Trial Balance sheet with Account Code, Account Name, Statement, IFRS Category, Current/Non-current, Debit Balance, Credit Balance, Net Balance, Review Status, and Notes columns.
List-based input controls for Statement, IFRS Category, and Current/Non-current classifications.
Financial Statements sheet with dollar values and percentage-of-revenue analysis for the profit or loss and OCI statement.
Statement of financial position with cash, trade receivables, property and equipment, trade payables, bank loan, totals, and equity lines linked to the trial balance.
Dashboard status panel with trial balance status, statement status, net profit margin, current ratio, and a current-ratio alert.
Three linked charts covering profitability comparison, assets by category, and capital structure.
Who uses an IFRS financial statements Excel template in the US
A US subsidiary reporting to a foreign parent, an LLC seeking lender reporting, and a controller preparing a year-end management package may all need IFRS-style presentation without immediately buying a full consolidation system. This workbook is designed for that reporting stage: the Trial Balance sheet holds the account-level mapping, while Financial Statements turns those classifications into a readable reporting package.
For a small reporting team
Consider a Texas consulting LLC with $1,200,000 of revenue, $420,000 of cost of sales, $510,000 of operating expenses, and $35,000 of finance costs. Its mapped accounts can produce $780,000 of gross profit, $270,000 of operating profit, and $235,000 before income tax. The Dashboard then displays revenue, gross profit, gross margin, operating profit, net income, assets, liabilities, equity, and current ratio.
An office manager can maintain the first draft after the monthly close; a bookkeeper or controller should review classifications before the package goes to the parent company, bank, or board. The Instructions sheet identifies the intended workflow and explains the distinction between user inputs, linked report values, and management review indicators.
At year-end and during monthly close
The workbook is useful after adjusting entries have been posted for depreciation, accrued expenses, income tax, loan interest, and other close items. For example, $160,000 of property and equipment belongs in Non-current Assets, while $80,000 of trade receivables belongs in Current Assets if collection is expected within the normal operating cycle.
Image 1 shows the Instructions sheet with the company profile, 01/01/2026–12/31/2026 reporting period, USD currency, workflow, IFRS notes, and color legend. Image 2 shows the Trial Balance layout, including the ten account columns and pale input areas. Image 3 shows the linked statement layout with Note, 2026, and % of Revenue columns, while image 4 shows Dashboard metrics, status checks, tables, and charts.

What IFRS presentation requires from the workbook
IFRS financial statements are not created merely by adding debits and credits. Your account mapping must support a statement of financial position, a statement of profit or loss and other comprehensive income, and an equity reconciliation that explains how closing equity was reached. This template supports that presentation structure, but it is a management reporting tool rather than evidence of full statutory compliance.
Classification and measurement discipline
The Trial Balance offers Current Assets, Non-current Assets, Current Liabilities, Non-current Liabilities, Equity, Revenue, Cost of Sales, Operating Expenses, Finance Costs, Income Tax Expense, and OCI. Current or non-current classification follows the workbook's stated test: expected realization or settlement in the normal operating cycle or within twelve months. A $65,000 supplier balance normally belongs in Current Liabilities; a long-term bank loan belongs in Non-current Liabilities unless the amount due within twelve months is separately classified.
Enter a debit or credit amount, not both. The row formula calculates Debit Balance minus Credit Balance, and the Review Status formula returns OK when the absolute difference is below $0.01. This is a control threshold, not an IFRS materiality judgment. A $0.005 rounding difference may pass the check while a $500 classification error will not be detected unless you review the account assignment.
US reporting and tax boundaries
For a US LLC, IFRS presentation does not replace federal tax reporting. A sole proprietor generally reports business activity on Schedule C; an LLC may be taxed as a partnership or corporation; and an S-corp uses Form 1120-S. Book income and taxable income can differ because of depreciation, meals, nondeductible expenses, or tax elections such as Section 179.
Keep supporting records generally for 3 years after filing, and longer for property, loss, or other records where the IRS period extends. The workbook does not calculate deferred tax, lease liabilities, impairment, foreign exchange translation, cash flows, disclosures, or consolidation adjustments, so those items require separate work before calling a package complete for statutory IFRS reporting.
Where IFRS spreadsheet reporting breaks down
The most expensive errors usually occur before the formulas run. A balance can be mathematically correct and still appear in the wrong statement. If a $90,000 customer receivable is coded as Revenue instead of Trade Receivables, revenue may be overstated by $90,000 and current assets understated by the same amount. The trial balance can remain balanced while the financial statements are misleading.
Misclassified current and non-current amounts
Long-term debt is another frequent problem. Suppose a $240,000 loan has $48,000 due within twelve months and $192,000 due later. Putting the entire balance in Non-current Liabilities makes the current ratio look stronger than it is. If current assets are $300,000 and current liabilities are shown as $100,000 instead of $148,000, the displayed ratio changes from 2.03x to 3.00x.
The workbook can calculate the ratio, but it cannot determine the contractual maturity schedule. You must split the account or adjust the classification before relying on the Dashboard's liquidity alert.
Debit-credit and equity errors
Entering $25,000 in both Debit Balance and Credit Balance creates a net balance of zero even though the row contains contradictory data. A blank row is treated differently from a populated row, so a user can also mistake an unused prepared row for a missing account. Review the yellow input cells, account notes, and status output together.
Retained earnings creates a separate risk. If opening retained earnings is $180,000, profit for the year is $65,000, and dividends are $20,000, closing retained earnings should be $225,000. Entering dividends as a positive addition or forgetting them entirely produces a $20,000 equity error that may not be obvious until the statement of financial position fails to reconcile.
Overreading a management dashboard
A green or positive result is not an audit opinion. The Dashboard's gross margin, net profit margin, current ratio, and charts are linked summaries; they do not test revenue recognition, expected credit losses, inventory valuation, depreciation method, provisions, related parties, or disclosure completeness. Use the output to focus review, not to skip it.

How to make the IFRS workbook part of your close
The workbook works best as a fixed close step rather than a file you rebuild at year-end. Assign one person to update the Trial Balance after the adjusted ledger is locked and another person to review classifications. For a four-employee contractor with 80 accounts, that division can reduce rework because the preparer enters balances while the reviewer investigates rows marked Review.
Use a repeatable close sequence
- Save a dated copy after each monthly or quarterly close, such as 09/30/2026, before replacing balances.
- Update Instructions first so the reporting period and preparer or reviewer names remain visible.
- Paste or enter the adjusted account balances, then scan the Review Status column and control totals before opening Dashboard.
- Compare current month or quarter results with the prior saved file, especially revenue, gross margin, current ratio, and total equity.
Keep input clean
Use the existing list controls instead of typing near-duplicate labels such as Current asset or Current assets. Keep account notes specific: “$48,000 current portion of loan” is more useful than “loan.” Pale yellow cells identify user inputs; calculated cells should not be overwritten.
After Excel recalculates, check that both status indicators show Balanced and that the current-ratio alert makes sense. If current assets are $300,000 and current liabilities are $250,000, the ratio is 1.20x and the dashboard should not be treated as a substitute for a cash forecast.
Know when to move on
Move to accounting or consolidation software when several users need simultaneous access, transactions exceed the prepared 100-row trial balance area, you need multi-entity eliminations, or you require audit trails and recurring consolidation adjustments. Keep this workbook for review and presentation only after the system of record has been established.
Frequently asked questions about this template
No. It is an IFRS-style management reporting template. It provides mapped statements, calculations, controls, and dashboard summaries, but it does not cover every recognition, measurement, disclosure, consolidation, deferred tax, lease, impairment, or cash flow requirement needed for statutory reporting.
Enter account code, account name, Statement, IFRS Category, Current/Non-current classification, one debit or credit balance, and notes. The sample has 100 prepared account rows from rows 4 through 103; Net Balance and Review Status are calculated outputs.
For each populated row, Net Balance equals Debit Balance minus Credit Balance. Review Status returns OK when the absolute difference is below $0.01 and Review when it is at least $0.01. The check does not validate whether the account classification is correct.
No. It reports an Income Tax Expense category when you provide a mapped balance, but it does not calculate federal or state tax. A sole proprietorship generally uses Schedule C, while an LLC's tax form depends on its classification; book income and taxable income may differ.
The Dashboard links revenue, gross profit, gross margin, operating profit, net income, total assets, total liabilities, equity, and current ratio from Financial Statements. It also includes trial balance and statement status, net profit margin, a liquidity alert, and three charts for profitability, assets, and capital structure.
Yes. Dividends may be entered directly in the equity reconciliation on Financial Statements when applicable. For example, opening retained earnings of $180,000 plus $65,000 profit less $20,000 dividends gives closing retained earnings of $225,000; review the supporting approval and ledger entry separately.
Meet the makers