
Accounting & Tax


Reverse DCF Excel - Free Template
Model the growth rate implied by a stock price, compare companies, and review valuation outputs in a practical reverse DCF Excel workbook.
2026-07-19
220 downloads
4.8/5
Download template
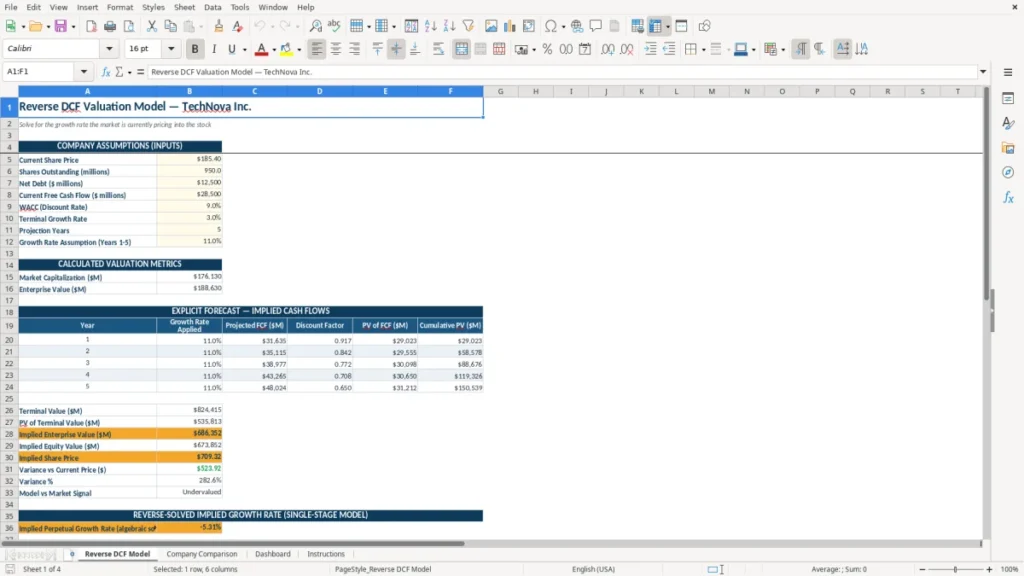
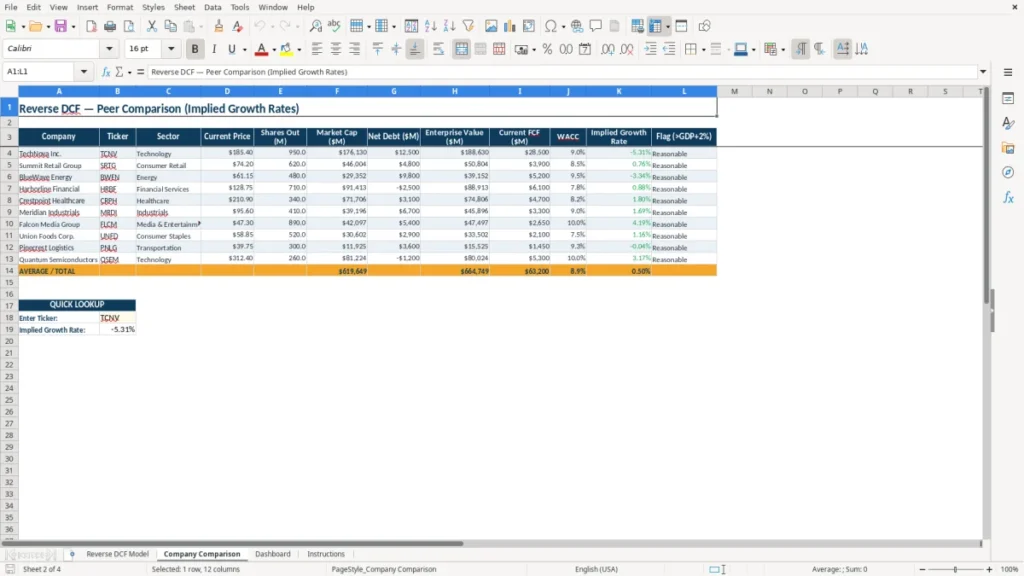
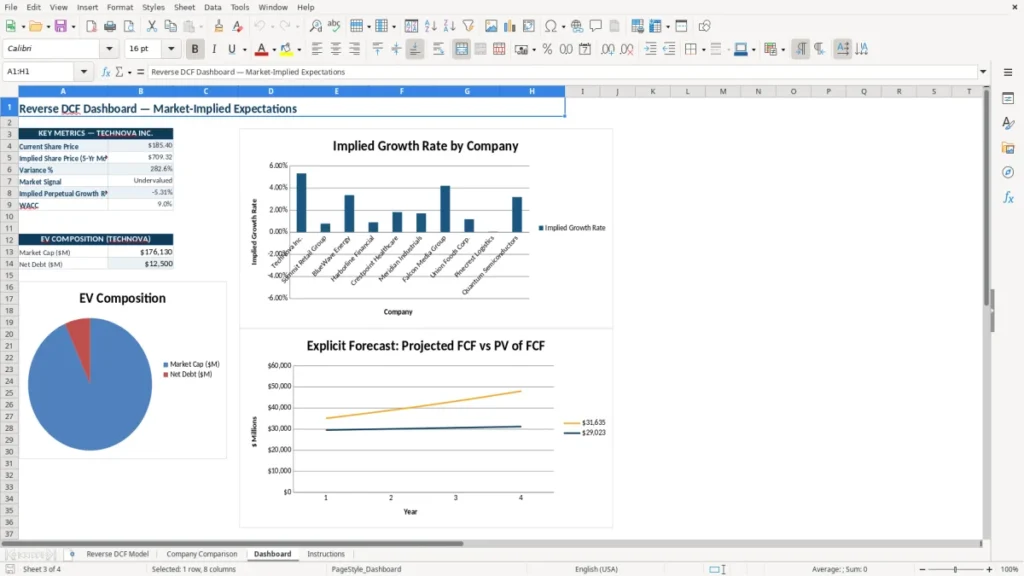
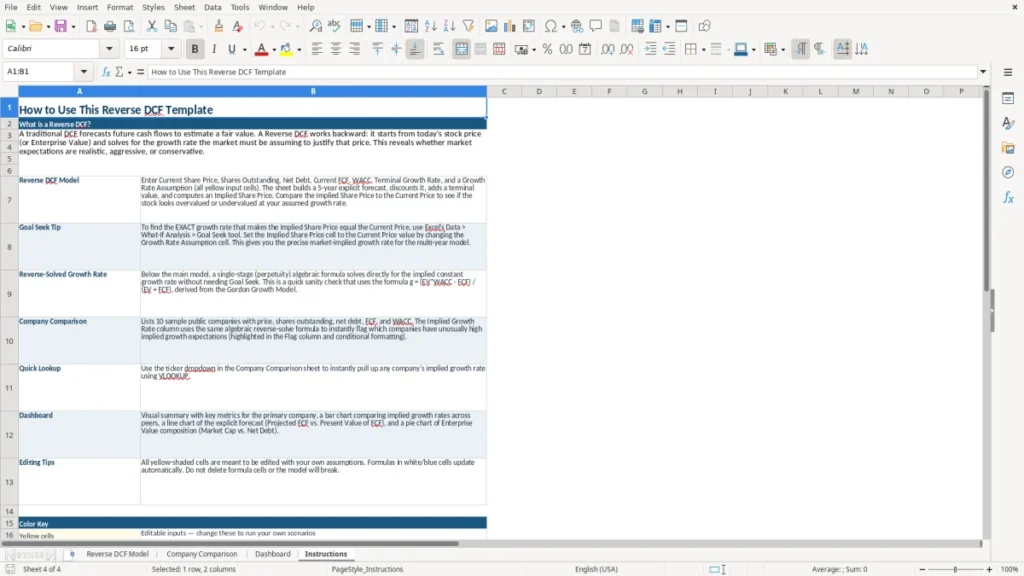
A reverse DCF Excel template works backward from a company's current stock price to estimate the revenue growth, margins, and cash-flow assumptions the market may be pricing in. This workbook contains a Reverse DCF Model, Company Comparison, Dashboard, and Instructions sheet for equity research and valuation review.
Enter operating assumptions and valuation inputs in the model, then use the implied growth result as a reality check against your own forecast. The formatted layout uses dollar, percentage, and numerical formats so you can compare assumptions without rebuilding the model from scratch.
The main benefits of this Excel template
- Shows the growth rate implied by a current share price instead of only calculating a target price from your own forecast.
- Separates the main Reverse DCF Model from company comparison and dashboard views.
- Makes optimistic assumptions visible by linking the valuation conclusion to revenue growth, margins, and free cash flow.
- Provides a structured place to compare multiple companies using consistent valuation assumptions.
- Reduces formula-building time for an analyst reviewing a stock before an earnings call, investment committee meeting, or portfolio rebalance.
- Uses clear currency, percentage, and number formatting to make valuation outputs easier to audit.
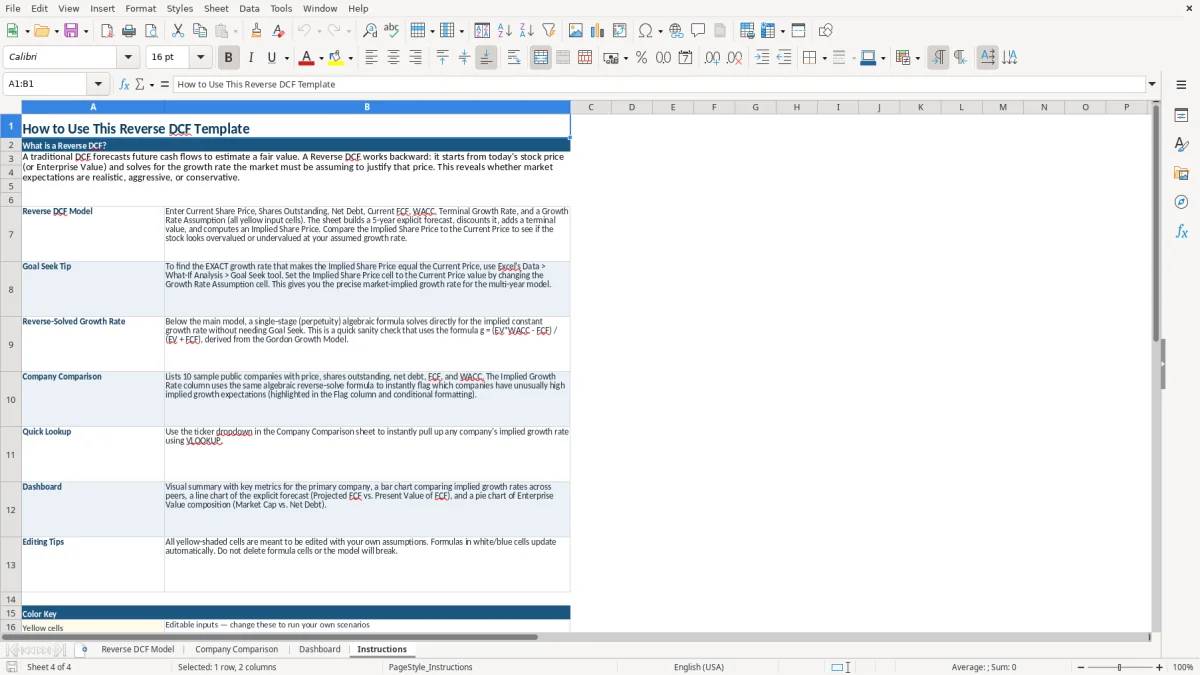
- Includes an Instructions sheet so you can follow the intended workflow before changing assumptions.
Step-by-step guide
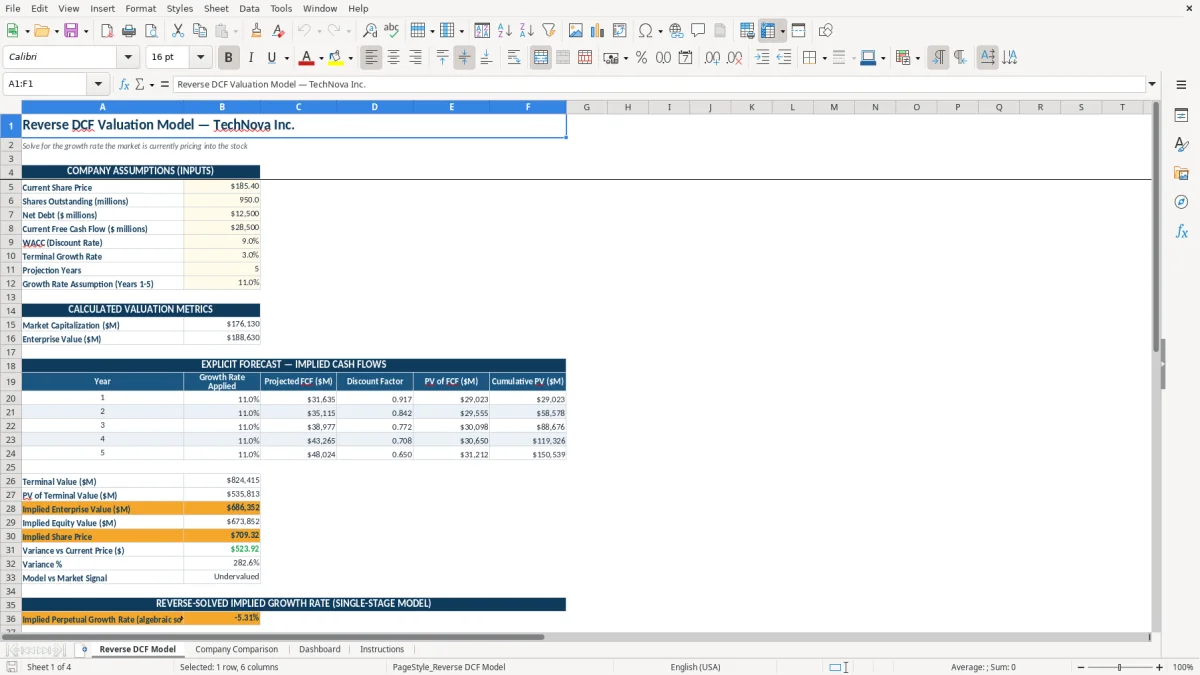
- Open the Instructions sheet first and review the workbook flow, then move to the Reverse DCF Model sheet shown in image 1.
- Enter the current share price, operating forecasts, cash-flow assumptions, and other company-specific inputs using the model's formatted input areas.
- Check that historical figures and forecast assumptions agree with the company's latest 10-K, 10-Q, earnings release, or investor presentation.
- Review the implied growth result produced by the reverse valuation rather than treating it as a forecast you must accept.
- Use the Company Comparison sheet to place the subject company beside peers on consistent operating or valuation measures.
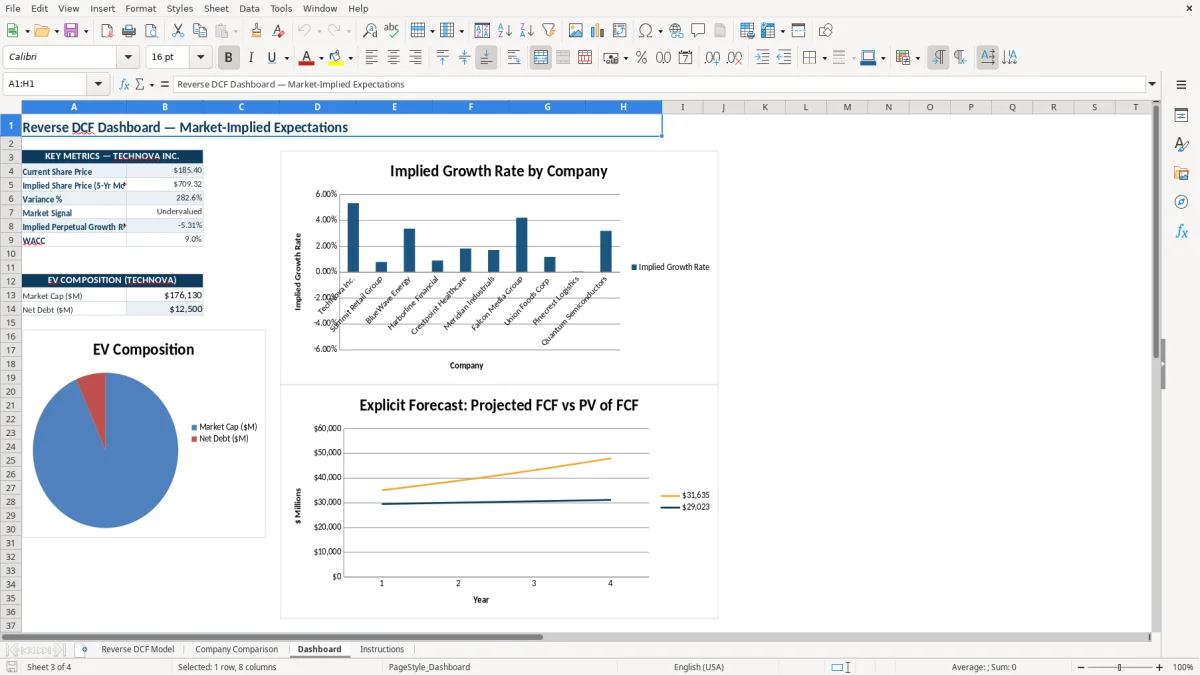
- Open the Dashboard sheet to review the key outputs visually, then test one assumption at a time to see which drivers have the greatest effect.
- Save a dated copy of the workbook with the source filings and assumptions used so you can compare the market's implied expectations at the next review.
What is included
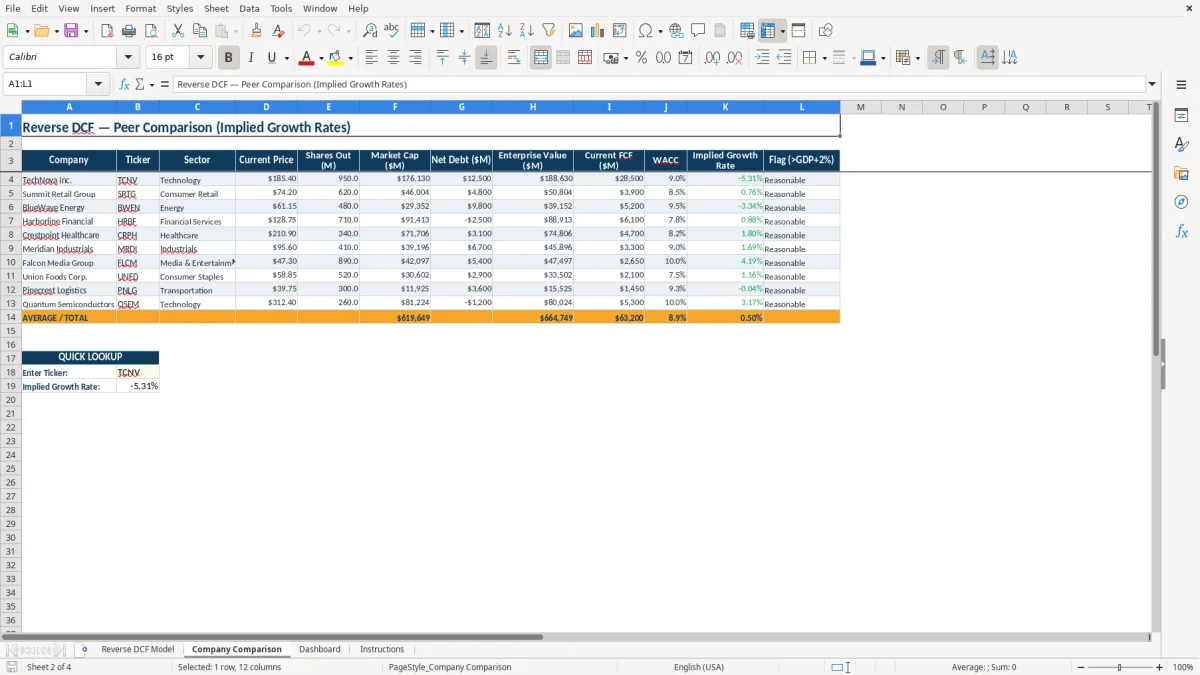
Four dedicated sheets: Reverse DCF Model, Company Comparison, Dashboard, and Instructions.
A formatted A:F model layout with a merged valuation title and a clear subtitle explaining that the model solves for market-implied growth.
Navy headers, blue section styling, amber input emphasis, alternating row fills, borders, and hidden gridlines for a readable analysis page.
Currency formats such as $1,234.00 and $1,234, percentage formats, and one-decimal number formats suited to valuation assumptions.
A comparison workspace for reviewing companies on a common basis instead of switching between separate files.
A dashboard view for summarizing the model's most important valuation conclusions.
An Instructions sheet that provides a starting point for entering data and interpreting the workbook.
Who uses a reverse DCF Excel model during an equity review
A reverse DCF is useful when you know the market price but do not yet know whether the required operating performance is realistic. A buy-side analyst may use it before an investment committee meeting, while a portfolio manager may use it after earnings to ask whether a 12% stock-price increase has also raised the growth expectations embedded in the valuation.
For example, suppose a software company trades at $80 per share and your forecast says revenue can grow 18% for five years. The important question is not only whether that forecast produces a high target price; it is whether the current $80 price already assumes 25% growth, a 30% operating margin, and expanding free cash flow. The Reverse DCF Model sheet gives you a place to test that question.
Where the workbook fits in the research process
Start with the company's reported financial statements, normalize unusual items, and then enter the assumptions you want to test. The workbook has four sheets: Reverse DCF Model, Company Comparison, Dashboard, and Instructions. Image 1 shows the first sheet's A:F presentation, including the merged title Reverse DCF Valuation Model — TechNova Inc. and the subtitle about solving for the growth rate priced into the stock.
After reviewing the model, move to Company Comparison when you need a peer context. A 300-order-per-month online retailer and a subscription software company should not be judged with identical margin expectations, so use comparable businesses with similar revenue models, reinvestment needs, and maturity.
A practical use case for a small investment team
Consider a two-person research team covering 20 companies. Each analyst can save a dated workbook after an earnings release, record the share price and source assumptions, and use the Dashboard sheet for the meeting summary. A consistent file is more useful than a complicated model that nobody can update before Friday's portfolio review.
A consistent file is more useful than a complicated model that nobody can update before Friday's portfolio review, much like a service record sheet keeps each job dated and easy to update.
The accounting inputs and valuation mechanics behind the model
A reverse DCF is not an IRS form or a statutory valuation method. It is a market-implied expectation exercise built on discounted cash flow logic: the current equity value is held as the conclusion, while one or more operating assumptions are solved or adjusted until projected cash flows support that value.
The core inputs normally come from GAAP financial statements and company filings. Revenue growth, operating margin, taxes, capital expenditures, changes in working capital, depreciation, terminal growth, and the weighted average cost of capital all affect free cash flow. A $100 million revenue business growing 20% for five years reaches about $249 million before margin, tax, and reinvestment effects are considered; that is why growth alone is not a valuation conclusion.
Use filing data consistently
Pull revenue, operating income, depreciation and amortization, capital expenditures, and working-capital movements from the same reporting period where possible. If you use adjusted EBITDA from an investor presentation but GAAP revenue from a 10-K, document the adjustment instead of mixing definitions silently. Image 1's currency, percentage, and numeric formatting helps you distinguish dollar inputs from rate assumptions, but it does not validate the source data.
For a public company, reconcile diluted shares outstanding, cash, debt, and other non-operating assets before moving from enterprise value to equity value. A $500 million debt balance incorrectly omitted from the bridge can overstate equity value by $500 million, regardless of how precise the discounting formula appears.
Take a disciplined position on assumptions
Use a reverse DCF as a starting-point test, not as proof that the market is wrong. I prefer a base case, downside case, and upside case rather than one highly precise answer: for example, 12%, 18%, and 24% revenue growth with separately justified margins. Keep the discount rate and terminal growth tied to a documented rationale; a 0.5 percentage-point change in either can materially change present value, especially when terminal value represents more than half of the result.
The valuation mistakes that distort an implied growth rate
The most expensive error is entering a plausible number in the wrong unit. If capital expenditures are reported as $40 million but entered as $40,000, the model may show unusually strong free cash flow and imply that the current share price requires only modest growth. That is not a subtle valuation disagreement; it is a 1,000-fold data-entry error.
Bad bridges create false confidence
Analysts often copy an equity value into an enterprise-value calculation without removing cash or adding debt. A company with $1.2 billion of equity value, $300 million of debt, and $100 million of cash has roughly $1.4 billion of enterprise value before other adjustments—not $1.2 billion. The resulting implied growth rate can be materially understated if the capital structure is not reconciled.
Another recurring problem is using a reported EBITDA margin as though it were a free-cash-flow margin. A 25% EBITDA margin does not mean 25% of revenue becomes cash after taxes, capital expenditures, lease payments, and working-capital investment. On $200 million of revenue, a 25% margin suggests $50 million of EBITDA; $15 million of capital expenditures and $8 million of working-capital investment leave a very different cash-flow picture before taxes and interest.
Terminal value hides weak forecasts
A model can appear reasonable while deriving 80% of its present value from terminal value. That usually means the explicit forecast period is too short, the terminal growth rate is too generous, or the discount rate is too low for the company's risk. A perpetual growth rate of 5% for a mature business is especially aggressive when long-run nominal economic growth is materially lower.
Do not overlook share dilution. If options, restricted stock, or stock-based compensation increase diluted shares from 100 million to 110 million, equity value per share falls by about 9% even if total enterprise value is unchanged. Review the Company Comparison and Dashboard outputs for consistency, then trace suspicious results back to the source assumption rather than rounding the answer until it looks familiar.
How to make reverse DCF analysis part of your investment routine
A reverse DCF becomes useful when you update it at a fixed point in your research calendar. Attach it to the earnings workflow: download the latest 10-Q or 10-K, update the share price and reported figures, save a dated copy, and record which assumptions changed. A 20-minute update after each quarterly release is more valuable than rebuilding the workbook once a year from memory.
Use a repeatable review sequence
- Update reported revenue, cash, debt, shares, and cash-flow figures first.
- Change only one forecast driver at a time, such as growth from 15% to 18%.
- Record the source and date beside your working notes outside the model if the workbook has no dedicated source field.
- Review the Dashboard after every major change and investigate any output that moves more than expected.
For instance, if the implied growth rate falls from 22% to 16% after a quarterly update, do not immediately call the stock undervalued. Check whether the share price fell, the diluted share count changed, net debt was reclassified, or a one-time working-capital benefit inflated the latest cash flow.
Keep the file clean and comparable
Use one workbook per company or one clearly labeled tab set, and name saved files with the company and review date. Do not overwrite the prior quarter. Comparing four dated files can show whether the market's implied expectations are rising faster than the company's actual operating performance.
The Company Comparison sheet is best used for a manageable peer group, such as six companies with similar economics. Once you are tracking hundreds of securities, importing filings, maintaining version history, and running scenario matrices, move to a financial-data platform or a controlled modeling system. Excel remains excellent for transparent review, but manual copy-and-paste becomes the risk when the process exceeds a few dozen recurring updates.
Frequently asked questions about this template
It works backward from a current stock price to estimate the operating assumptions needed to justify that price, such as revenue growth, margins, and free cash flow. The workbook presents the calculation through the Reverse DCF Model sheet and summarizes results on the Dashboard sheet.
The file contains four sheets: Reverse DCF Model, Company Comparison, Dashboard, and Instructions. Image 1 corresponds to the Reverse DCF Model sheet; the remaining sheets support peer review, output review, and workbook guidance.
You can adapt the workbook to many public companies, but the assumptions must match the business. A capital-light software company, a manufacturer with heavy capital expenditures, and a bank require different cash-flow definitions and valuation inputs.
Collect the latest revenue, operating income, depreciation and amortization, capital expenditures, working-capital changes, cash, debt, diluted shares, share price, tax assumptions, discount rate, and terminal growth assumption. Use the same reporting period and document adjustments from the company's 10-K, 10-Q, or earnings materials.
No. A regular DCF starts with your operating forecast and calculates an implied enterprise or equity value. A reverse DCF starts with the observed market value and solves for the forecast assumptions embedded in that price.
Update it after each quarterly earnings release or whenever the share price, debt, cash, diluted shares, or long-term forecast changes materially. Save a dated copy instead of overwriting the prior version so you can see how the market-implied growth rate changes over time.
Meet the makers